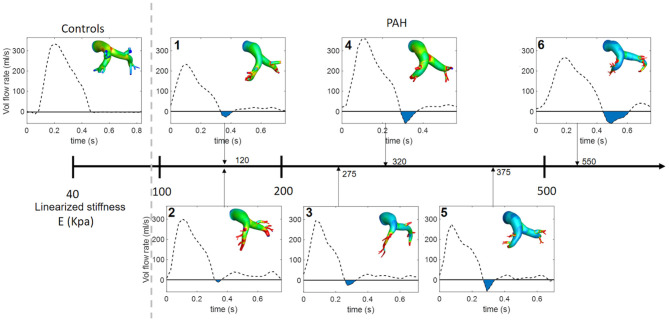
Figure 4.
Volumetric flow waveform of control subject CTL-2 as an example of the characteristic wavefrom in controls (left) and measured waveforms for each PAH patient arranged with increasing linearized stiffness E. Blue shaded region denotes total regurgitant flow in the proximal PA. The color countour, which is used in Figure 3. represents the maximun surface displacement.

