Figure 5.

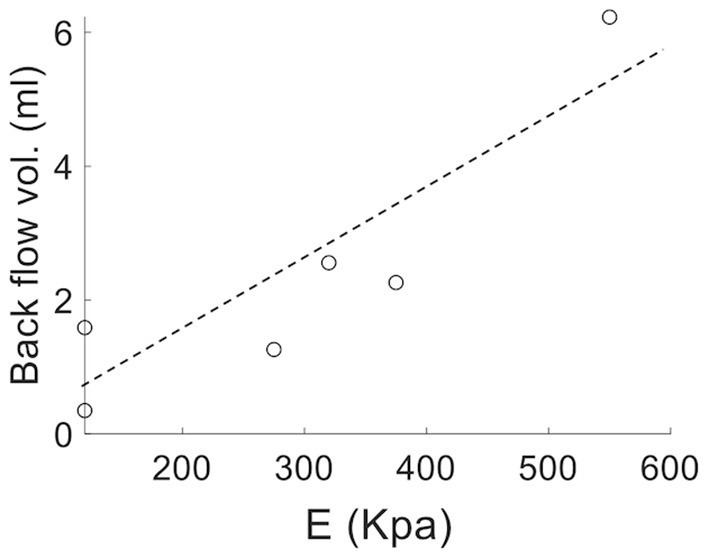
Volume of the total regurgitant flow over a cardiac cycle vs. linearized stiffness E for all PAH patients showing a linear correlation (r = 0.84, P = 0.018).

Volume of the total regurgitant flow over a cardiac cycle vs. linearized stiffness E for all PAH patients showing a linear correlation (r = 0.84, P = 0.018).