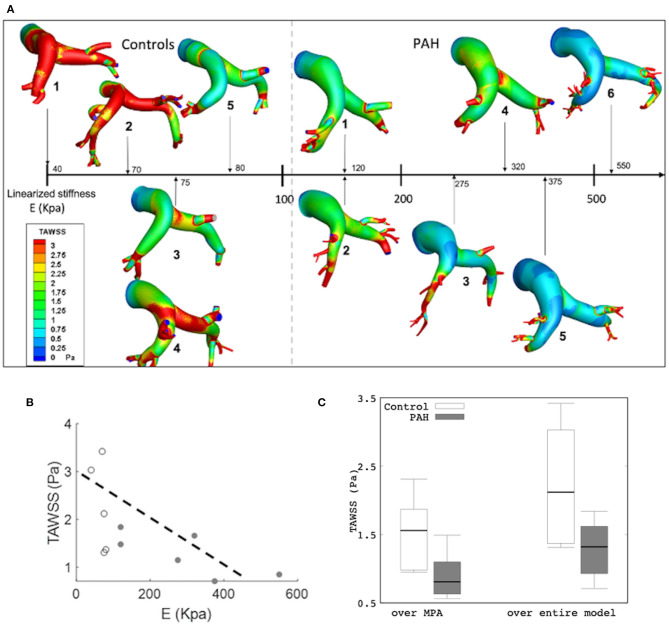
Figure 7.
(A) Color-coded spatial distribution of TAWSS for all subjects (control and PAH) arranged with increasing linearized stiffness E. (B) Averaged TAWSS (over the entire model) as a function of E showing a weaker correlation (r = −0.646; P = 0.032) and a stronger correlation (r = −0.746; R = 0.088) in all and only PAH subjects, respectively. Control (white) and PAH (gray). (C) Comparison of TAWSS averaged over the MPA (control: median: 1.56 Pa, IQR: 0.89 Pa vs. PAH: median: 0.81 Pa, IQR: 0.47 Pa) and over the entire model (median: 1.32 Pa, IQR: 0.69 Pa vs. median: 2.12 Pa, IQR: 1.66 P; P = 0.062) between PAH and control groups.

