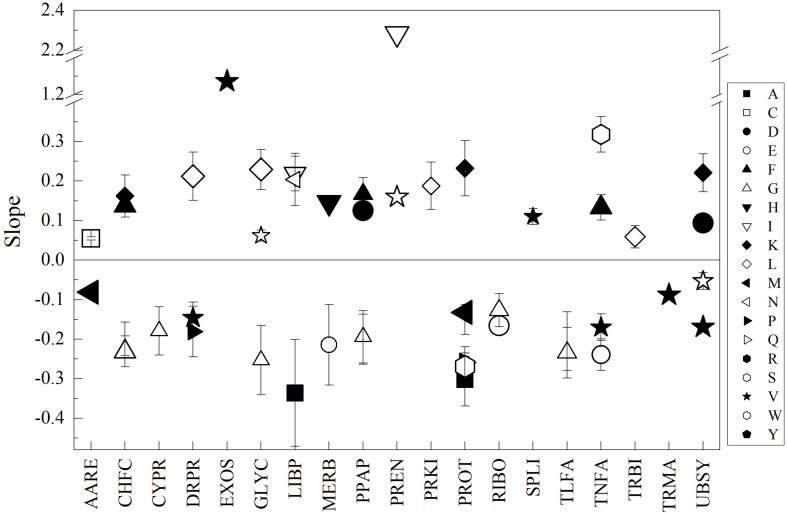
FIGURE 3.
Relationships between the content of amino acids and optimal temperature for growth among yeasts. The difference between yeasts in their amino acid content by CDS groups (indicated in the X-axis) were plotted vs. their difference in optimal temperature for growth, and linear regression was applied. The slopes from regressions with R2 ≥ 0.7 are shown. The size of the symbol represents R2 from 0.7 to 1.0.

