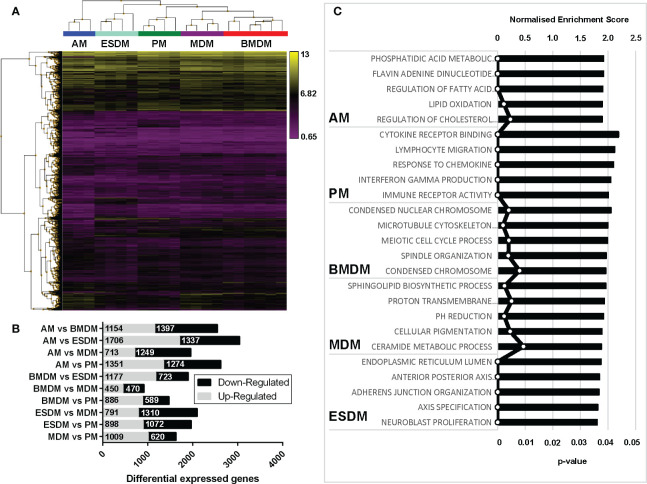
Figure 3.
Comparison of rat macrophage gene expression in vitro. Microarray analysis was performed on in vitro cultured rat macrophages. (A) Hierarchical clustering of the top 5,000 differentially expressed genes sorted by false discovery rate (FDR; <0.009418). Three biological replicates were used for alveolar (AM), bone marrow-derived (BMDM), monocyte-derived (MDM) and peritoneal macrophages (PM), including technical replicates. Technical replicates were used ESC-derived macrophages (ESDM) obtained from a single ESC clone (DA5.2). (B) Graph shows the numbers of differential expressed genes for each of the rat macrophages. (C) Gene ontology-based gene sets that were enriched in each macrophage population compared to all the others were identified using Gene Set Enrichment Analysis.

