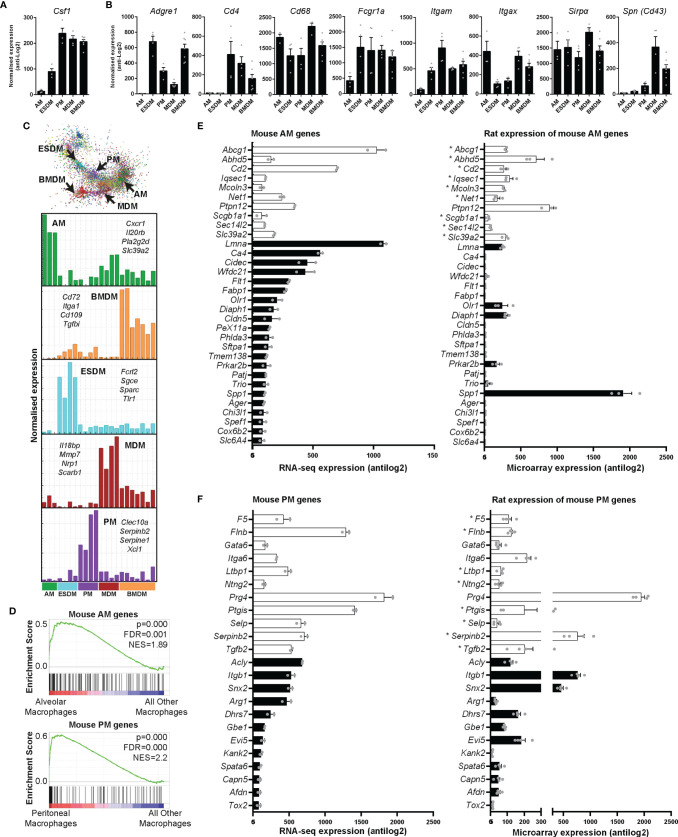
Figure 4.
Expression of rat macrophage genes. Microarray analysis was performed on in vitro cultured rat macrophages. Data were RMA-normalised and expression levels (antilog2) examined. (A) Expression of Csf1 in rat macrophages. (B) Expression of macrophage-specific genes encoding commonly-used surface markers including those for which there are no anti-rat antibodies. Graphs (A, B) show average + SEM. (C) The network graph generated by Graphia analysis in which genes are coloured by clusters of co-expression. Histograms show expression profiles of clusters that contained genes specific to each macrophage population. The genes listed encode cell surface proteins. AM = alveolar macrophages, BMDM = bone marrow derived macrophages, MDM = monocyte derived macrophages, PM = peritoneal macrophages, ESDM = embryonic stem cell derived macrophages. (D) Global enrichment of mouse macrophage AM and PM signature gene sets (5) in rat AM and PM identified by Gene Set Enrichment Analysis. Rat expression data are ranked according to differential expression in AM or PM compared to all other macrophage populations (indicated by red-blue bars), and the murine AM or PM genesets are mapped onto this profile (black bars) to determine enrichment score (green lines). NES = Normalised Enrichment Score. (E, F) The differentially expressed genes identified by Lavin and colleagues (44) were clustered using Graphia. The graphs show expression of genes identified in the mouse alveolar (AM) and peritoneal (PM) macrophage clusters. The genes represented by open bars were common to both mouse and rat AM clusters. Rat genes denoted with an asterisk (*) have provisional or model RefSeq status on the Rat Genome Database (rgd.mcw.edu). Graphs show mean + SEM.

