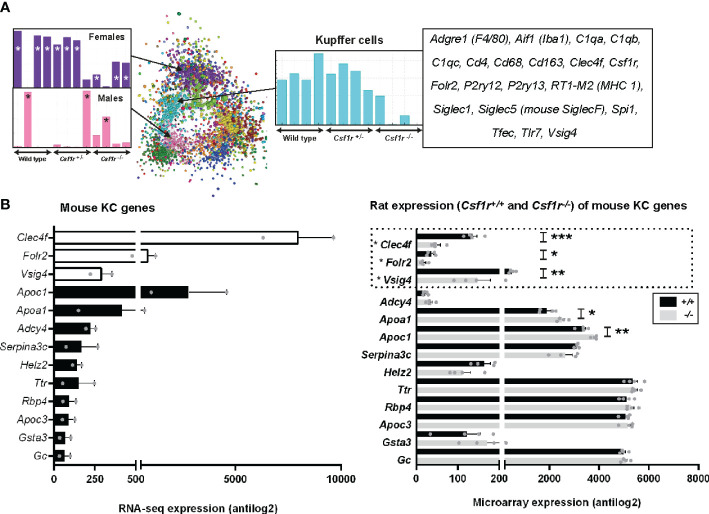
Figure 5.
Inferred gene expression profile of rat Kupffer cells. (A) Microarray analysis was performed on adult livers obtained from wild type, Csf1r+/- and Csf1r-/- rats (n = 4 per genotype). Data were RMA-normalised and analysed using Graphia. (A) The network graph generated by the Graphia analysis. Genes are coloured by clusters of co-expression. Expression profiles of clusters that contained genes specific to Kupffer cells (cluster 4), females (cluster 3) and males (cluster 7) are shown. (B) The differentially expressed genes identified by Lavin and colleagues (44) were clustered using Graphia. The graphs show expression of genes identified in the mouse Kupffer cell (KC) cluster. The genes represented by open bars or within the dotted line were common to both mouse and rat KC clusters. Rat genes denoted with an asterisk (*) have provisional or model RefSeq status on the Rat Genome Database (rgd.mcw.edu). Graphs show mean + SEM. p = 0.0007 (*** Clec4f), 0.0414 (* Folr2), 0.0024 (** Vsig4), 0.0209 (* Apoa1), and 0.0091 (** Apoc1) via an unpaired t-test.

