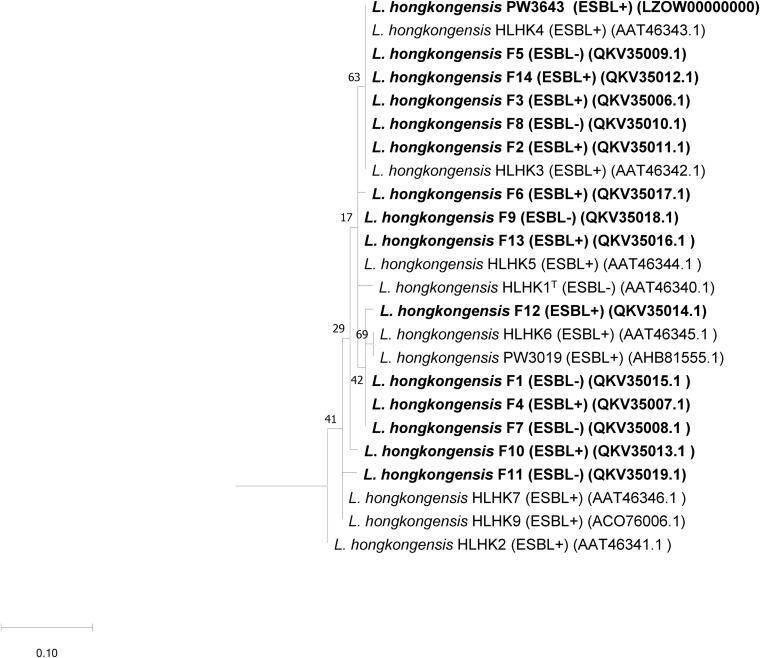
FIGURE 3.
Phylogenetic analysis of the AmpC of “ESBL-positive” and “ESBL-negative” L. hongkongensis isolates detected in the present study and their relationship with AmpC sequences of other L. hongkongensis isolates. The tree was constructed using the maximum likelihood method and Pseudomonas oleovorans (LR130779.1) as the root. Numbers at nodes indicated level of bootstrap support calculated from 1,000 replicates and the scale bar indicates the number of amino acid substitutions per site. Sequences determined in the present study are shown in bold.

