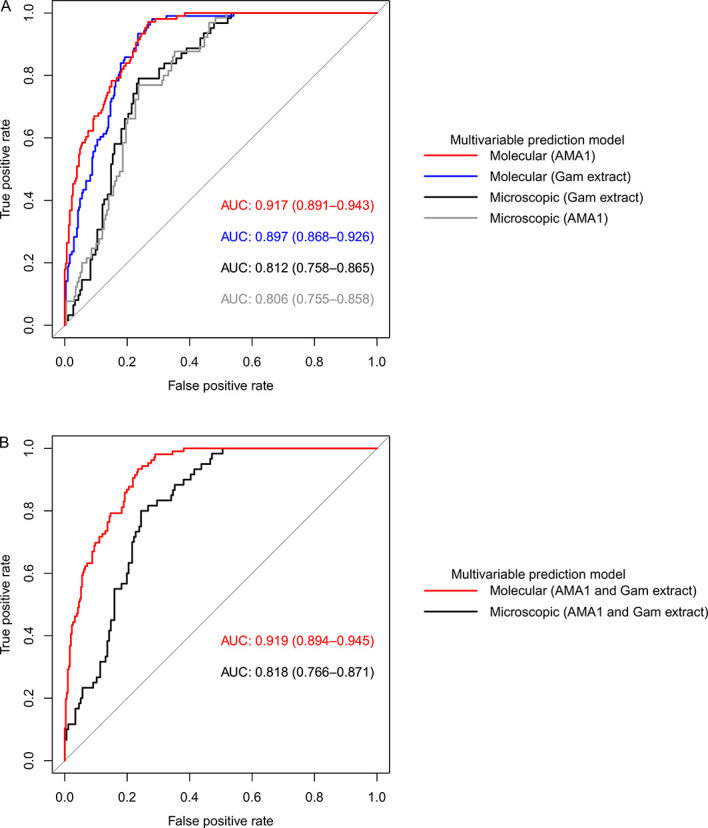
Figure 6.

Receiver operating characteristic (ROC) curves showing the predictive power of molecular and microscopic gametocyte carriage prediction models. (A) ROC curves for multivariable models adjusted for AMA1 and gametocyte extract independent of each other and (B) multivariable models adjusted for both AMA1 and gametocyte extract. The predictive power was measured by area under curve (AUC).
