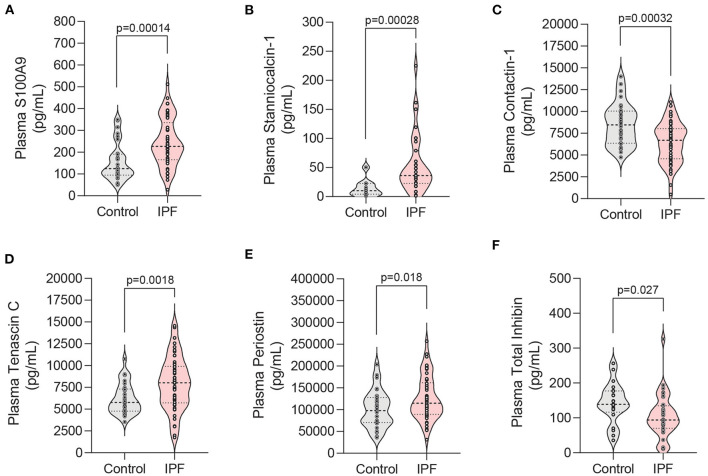
Figure 5.
Analysis of candidate biomarkers in plasma from IPF patients and controls. (A–F) Violin plots of candidate biomarkers identified in RNA-seq and proteomic analyses that displayed statistically significance differences in patient plasma samples. Plasma from patients with IPF (n = 50) and controls (n = 30) was analyzed using a custom Luminex panel. Median and interquartile range is shown. Significance defined as P < 0.035 by Welch's t-test using the Benjamini-Hochberg procedure to correct for multiple testing while utilizing a pre-defined 10% false discovery rate.

