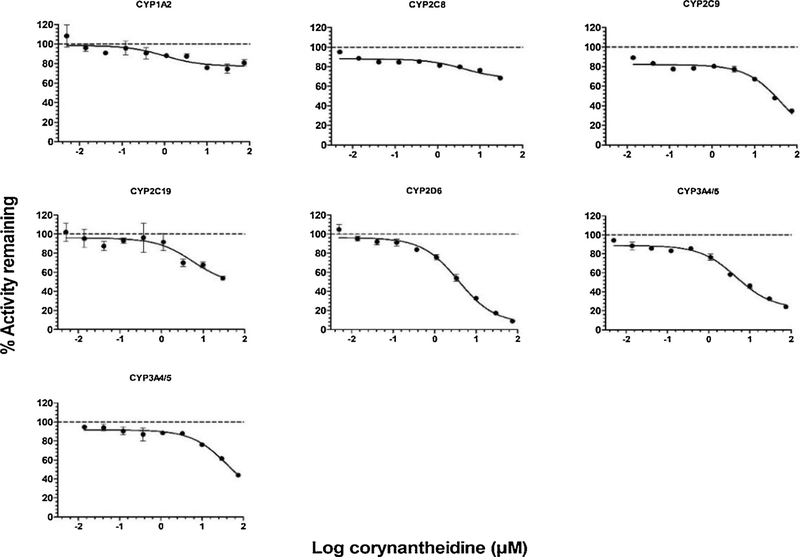
Fig. 3.
Inhibition curves of corynantheidine (COR) for human CYP450 activities using probe substrates in HLMs, phenacetin O-deethylase for CYP1A2, amodiaquine N-deethylase for CYP2C8, diclofenac 4′-hydroxylase for CYP2C9 (top panel left to right), S-mephenytoin 4′-hydroxylase for CYP2C19, dextromethorphan O-demethylase for CYP2D6, midazolam 1′-hydroxylase for CYP3A4/5 (middle panel left to right) and testosterone 6β-hydroxylase for CYP3A4/5 (bottom). The data plotted as the mean ± SD of triplicate determinations. The solid lines represent the best fit to the data using nonlinear regression.

