Figure 2.

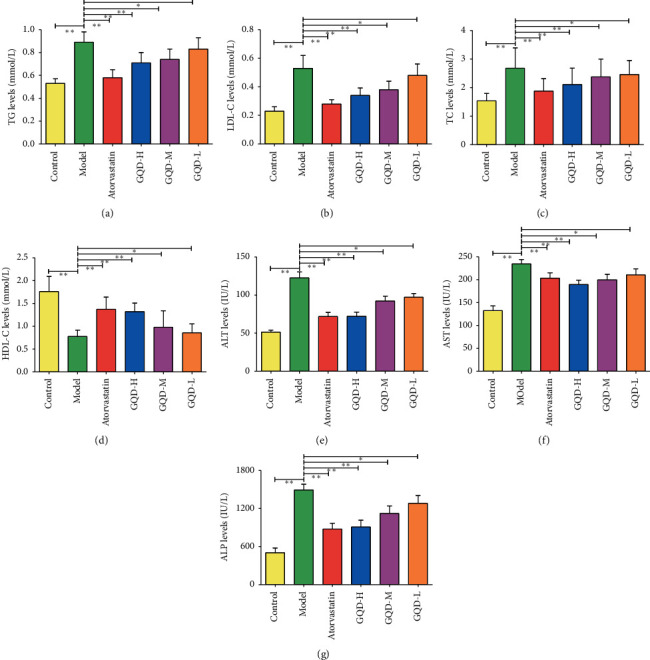
The effect of GQD on blood lipid related indexes in NAFLD rats (n = 10) ((a) TG, (b) LDL-C, (c) TC, (d) HDL-C, (e) ALT, (f) AST, and (g) ALP). Note: compared with the model group, ∗P < 0.05; ∗∗P < 0.01.

The effect of GQD on blood lipid related indexes in NAFLD rats (n = 10) ((a) TG, (b) LDL-C, (c) TC, (d) HDL-C, (e) ALT, (f) AST, and (g) ALP). Note: compared with the model group, ∗P < 0.05; ∗∗P < 0.01.