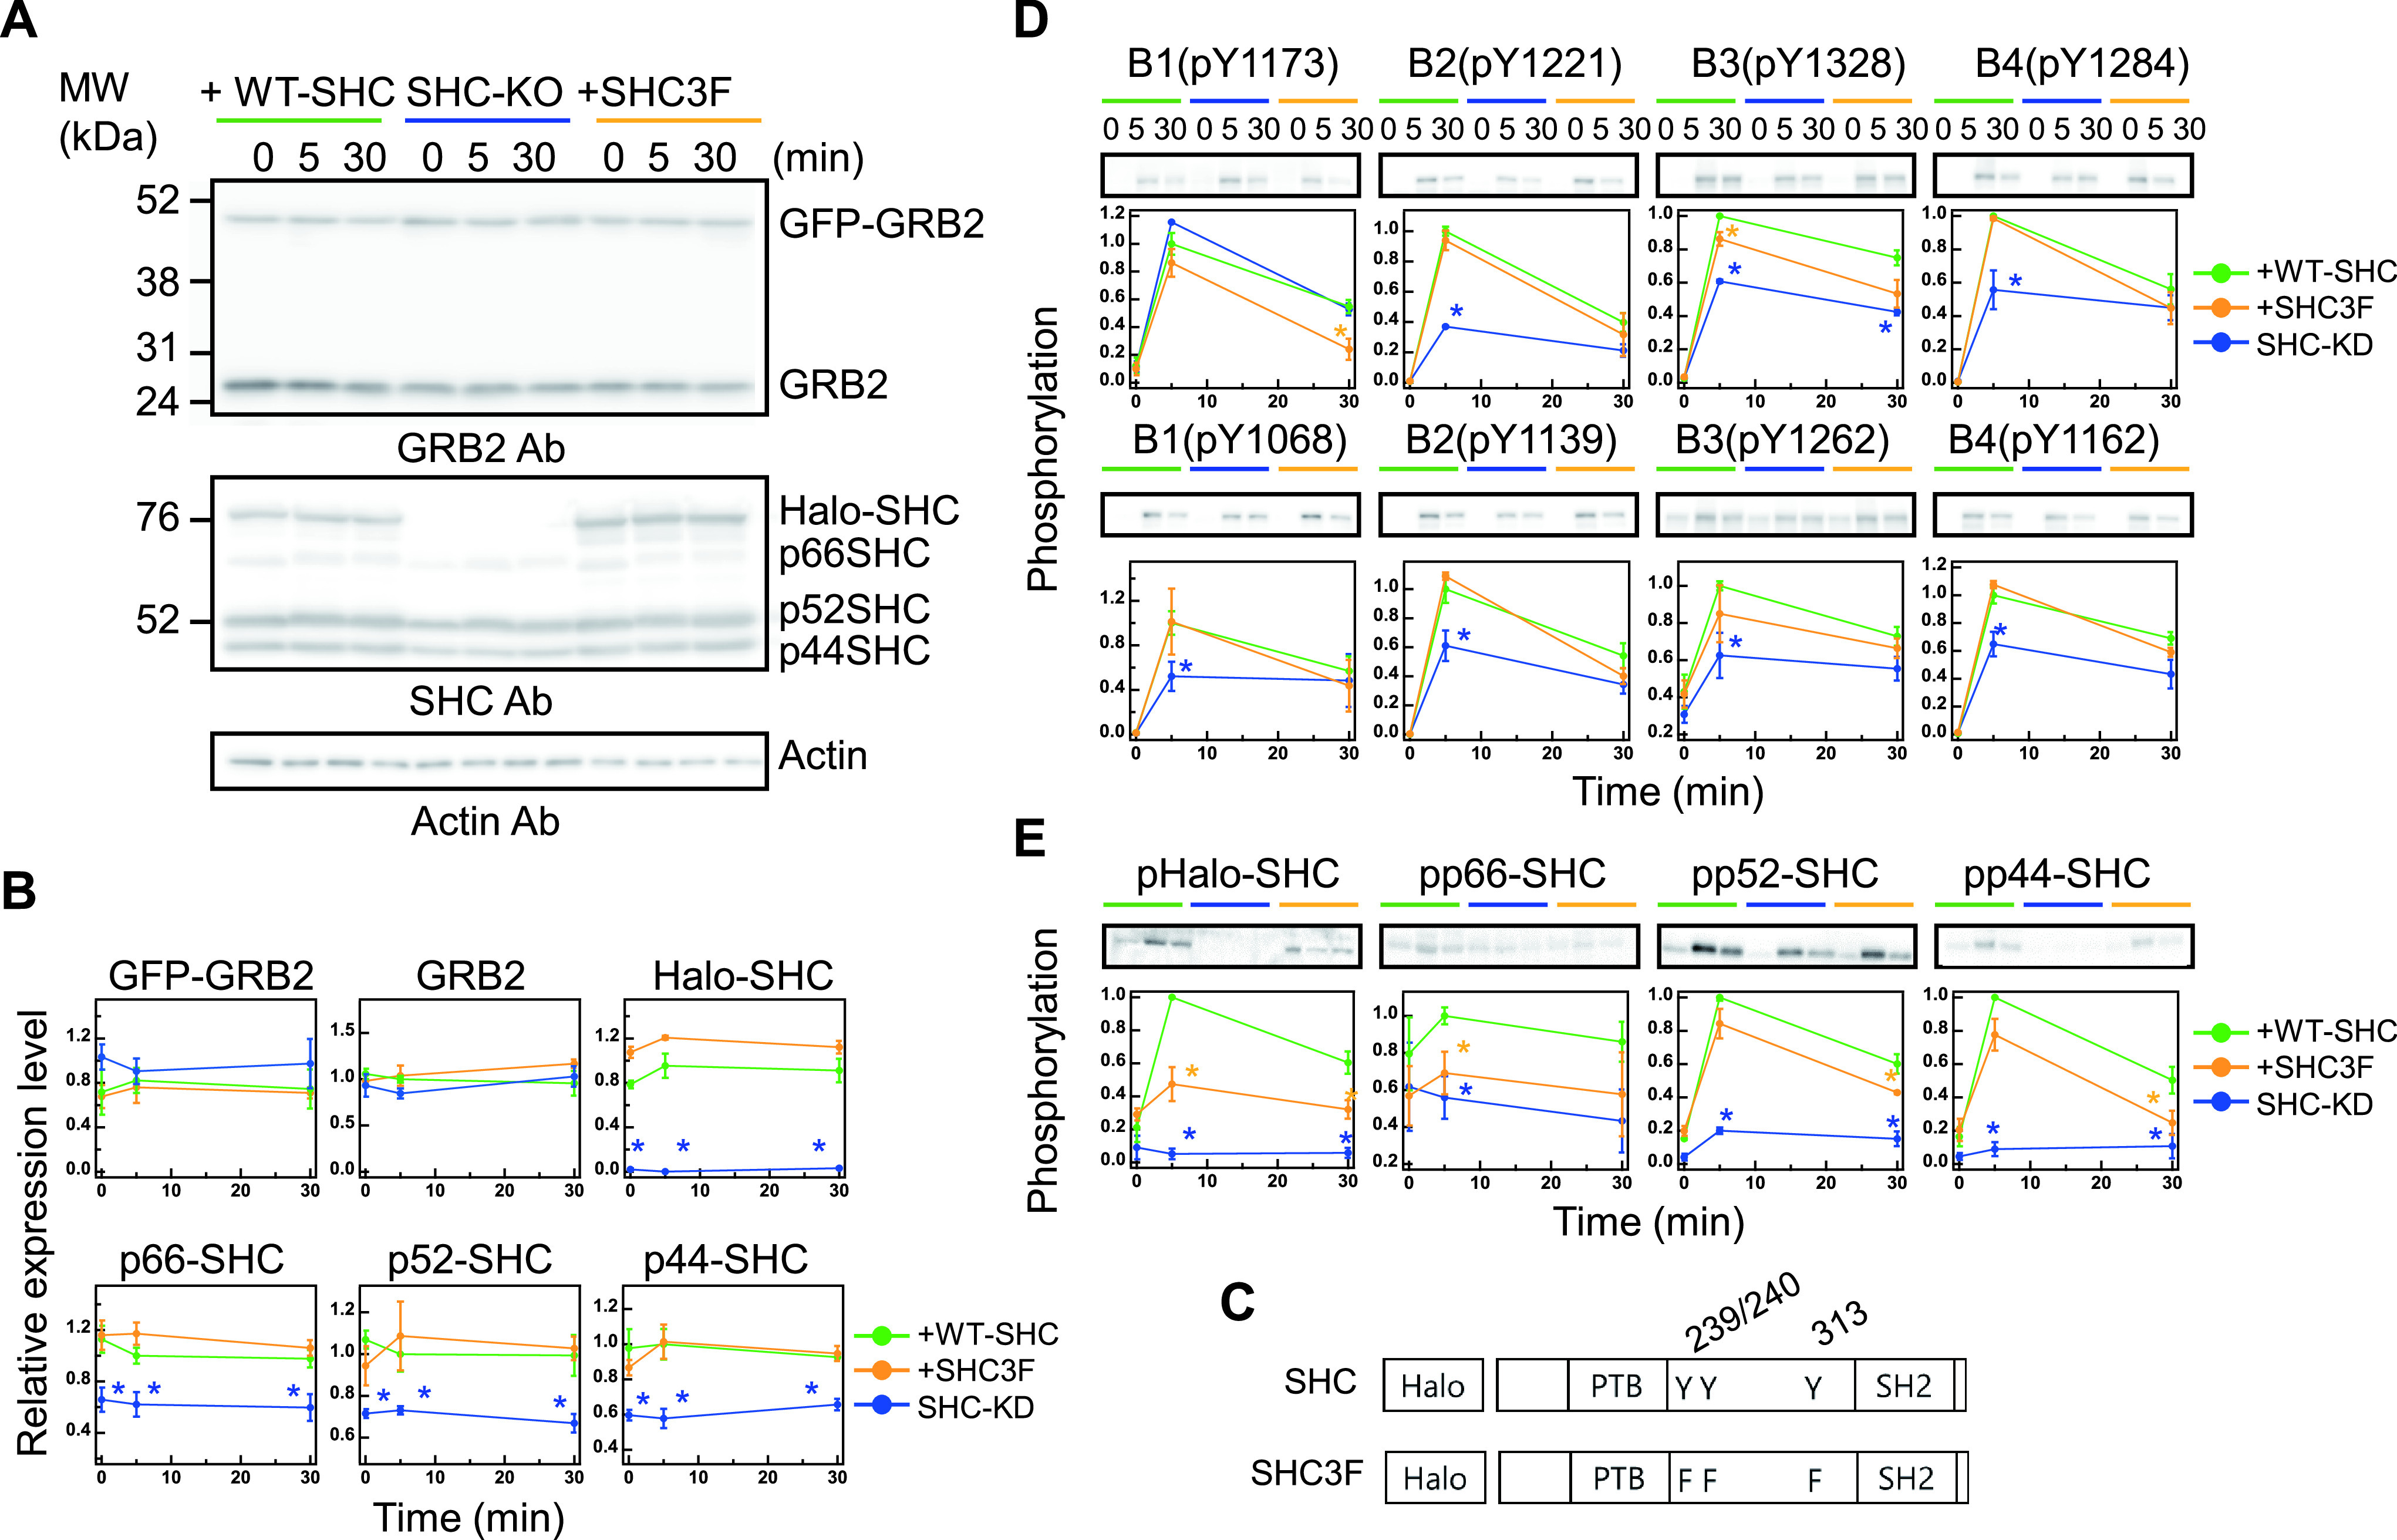
Figure 1 .

Protein expression and phosphorylation dynamics. (A) The expression profiles of GFP-GRB2 (upper panel), Halo-SHC or Halo-SHC3F (middle panel), and the corresponding endogenous proteins under the indicated cell conditions were assessed by western blotting analysis of cell lysates with the indicated antibodies (Ab). MW, molecular weight markers. (B) Changes in GRB2 and SHC expression after HRG stimulation (0, 5, and 30 min). Values were normalized as described in the Methods section. The expression levels of GFP-GRB2 and Halo-SHC were normalized using the corresponding endogenous protein levels without stimulation, respectively. (C) Schematic structures of the SHC constructs. The HaloTag was fused to the N-termini of the constructs. Numbers represent the amino acid positions. (D, E) Time course analysis of the ERBB receptor (D) and SHC (E) phosphorylations after HRG stimulation (0, 5, and 30 min). Phosphorylations shown in the upper and lower panels in (D) are those of the major SHC and GRB2 binding sites, respectively. Values were normalized as described in the Methods section. In (B, D, E), the mean values for three independent experiments were plotted along with the standard error. Asterisks denote statistical significance against the values obtained in control cells expressing WT-SHC (p<0.05 by t test).
