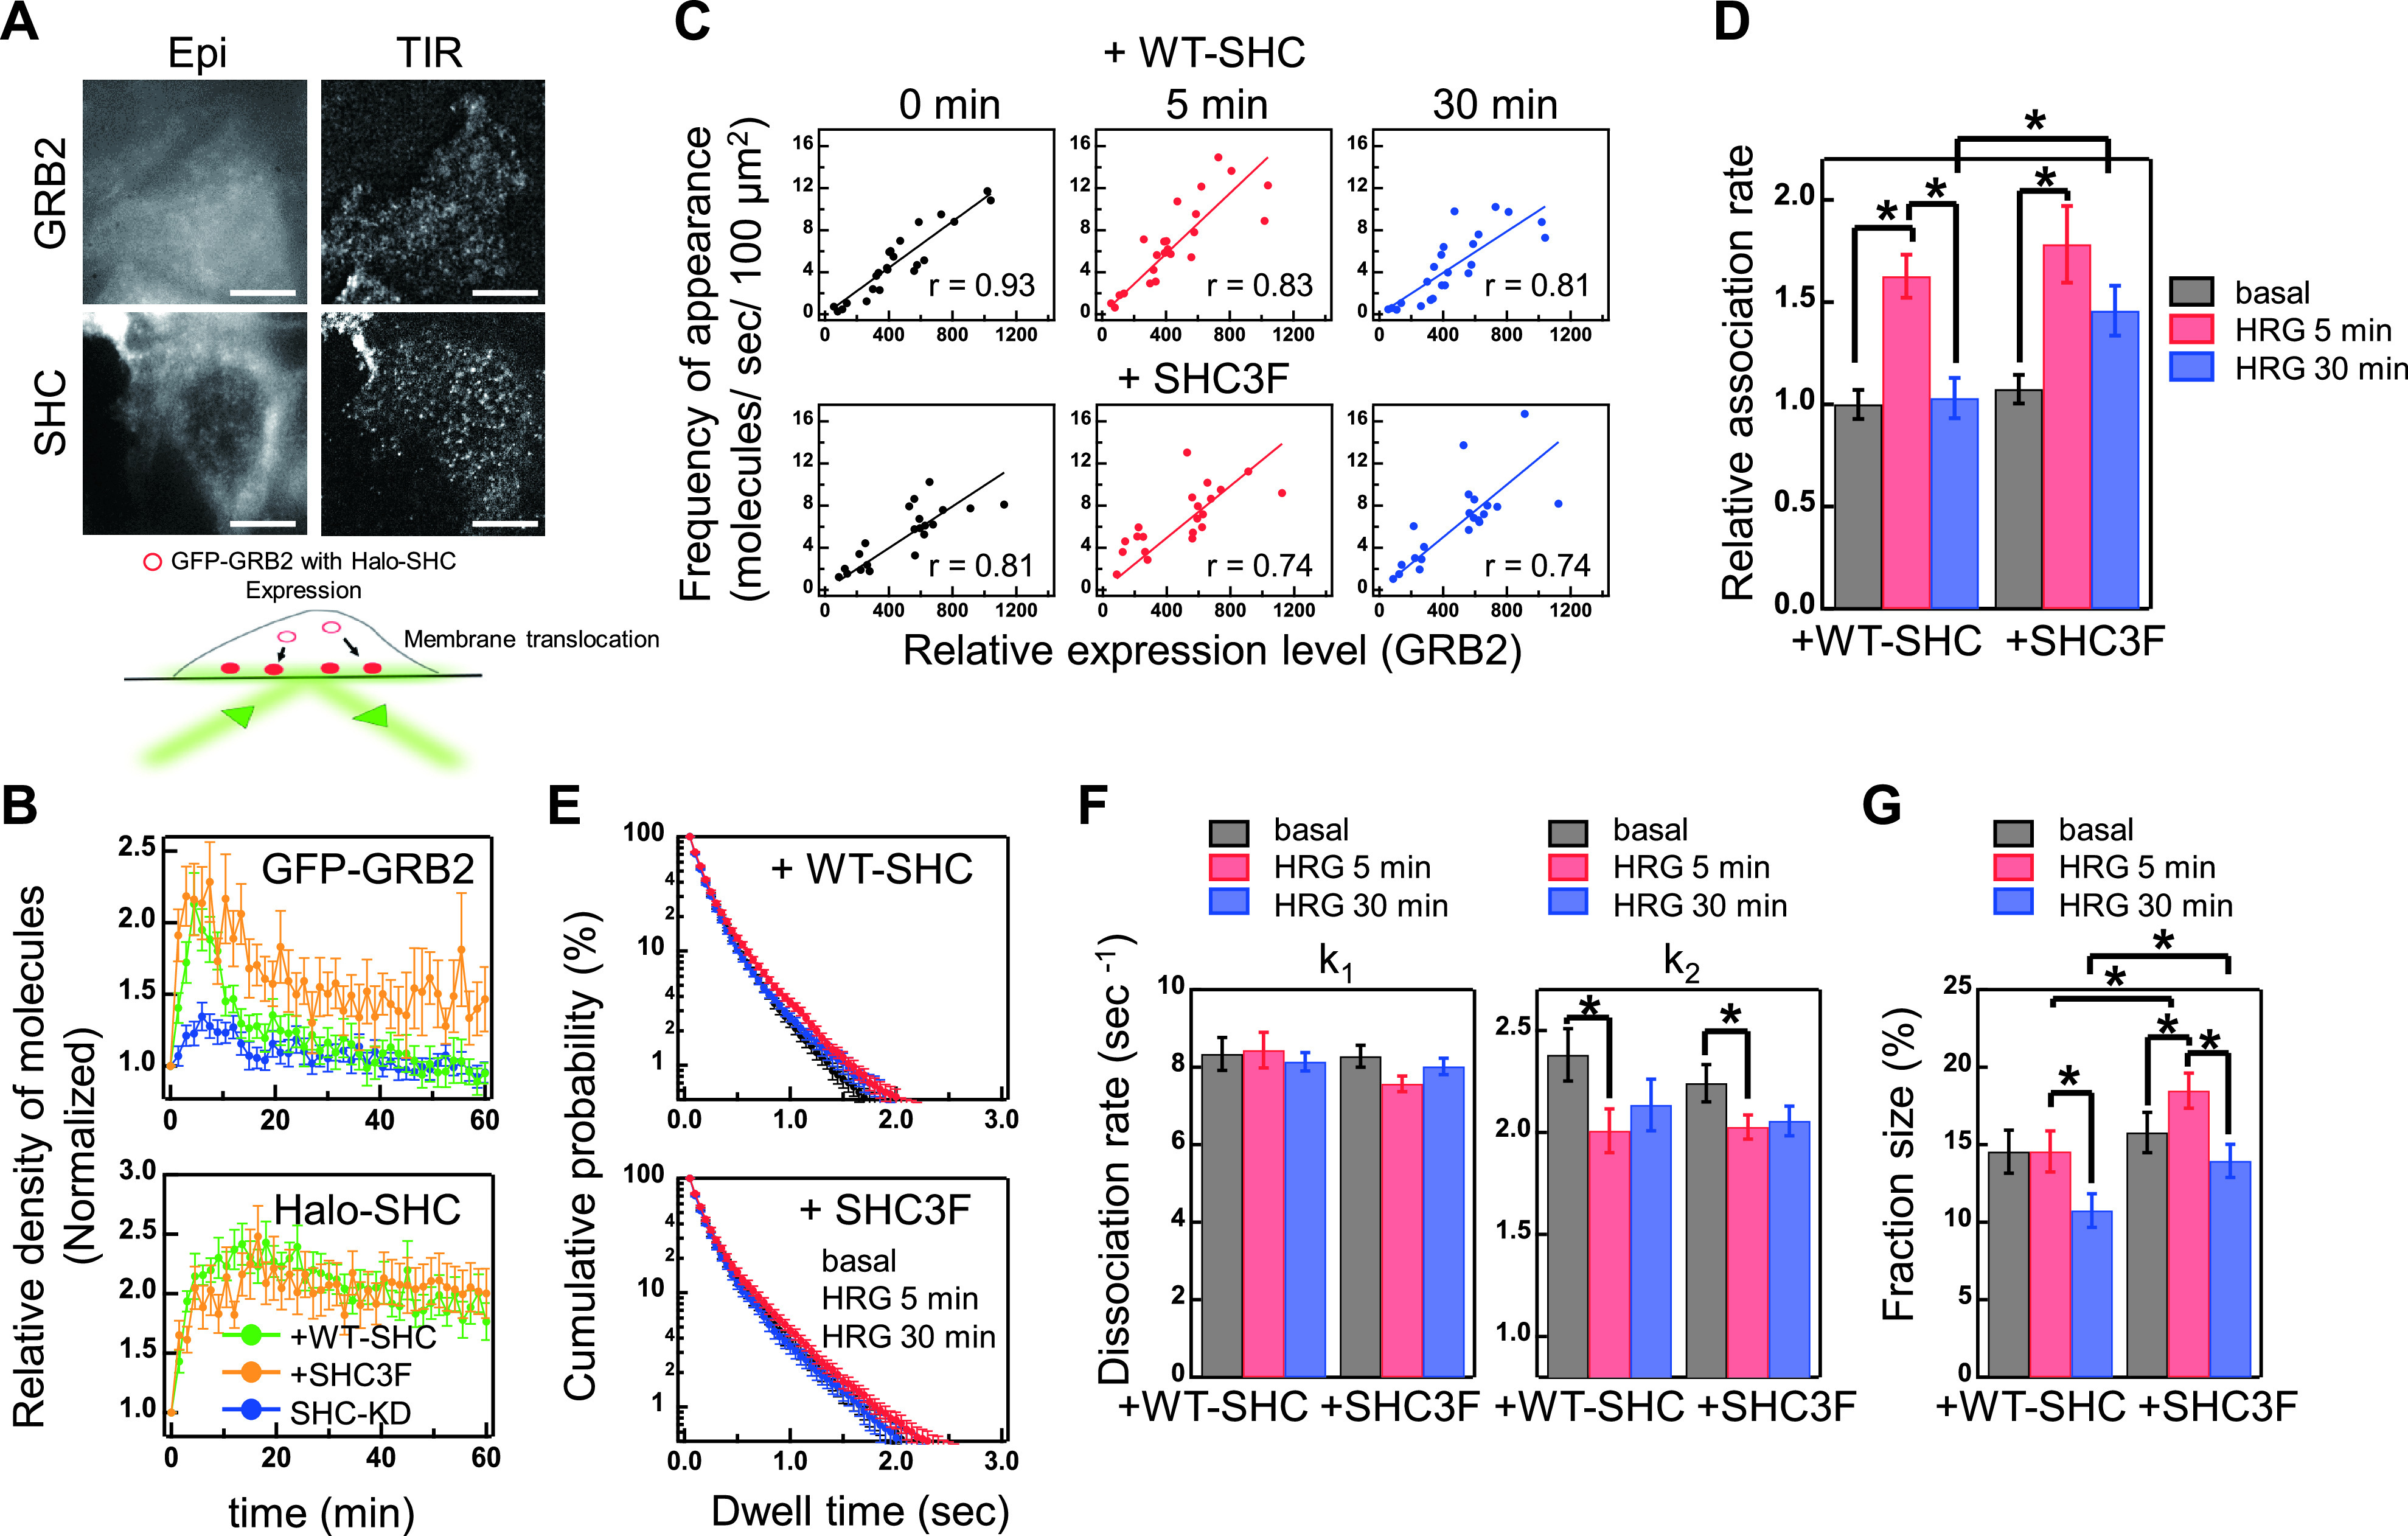
Figure 2 .

Membrane translocation of GRB2 and SHC. (A) Epi-fluorescence (Epi) and TIRF (TIR) images of GFP-GRB2 and Halo-SHC in MCF7 cells. Scale bar,10 μm. (B) Time course of GFP-GRB2 (left) and Halo-SHC (right) translocations to the plasma membrane. Cells were stimulated with 10 nM HRG at time 0. Cells co-expressing GFP-GRB2 and WT (green) or 3F mutant (orange) of Halo-SHC and expressing GFP-GRB2 with an SHC-knockdown (blue) were examined. Vertical axes were normalized to the values obtained before stimulation. The mean values for 16–32 cells were plotted along with the standard errors. (C) Frequencies of appearance of GFP-GRB2 molecules (relative numbers/sec/100 μm2) on the plasma membrane were plotted against the relative expression level of GFP-GRB2 observed by epi-illumination. Results of linear fitting (lines) are shown with the correlation coefficient, r. (D) Relative association rate constants for GRB2. (E) Dwelling time distributions of single GFP-GRB2 particles on the basal plasma membrane. (F) Dissociation rate constants for the fast (k1, left) and slow (k2, right) dissociation components of GRB2. (G) Fraction sizes for the slow dissociation component of GRB2. Cells in (C-G) were co-expressed with GFP-GRB2 and either WT SHC or its 3F mutant. In (D-G), the mean values before (black), and at 5 min (red), and 30 min (blue) after HRG stimulation are shown with standard errors. Number of cells examined were 21–24 (D), and 27–32 (E-G). Asterisks denote statistical significance (p<0.05 by t test).
