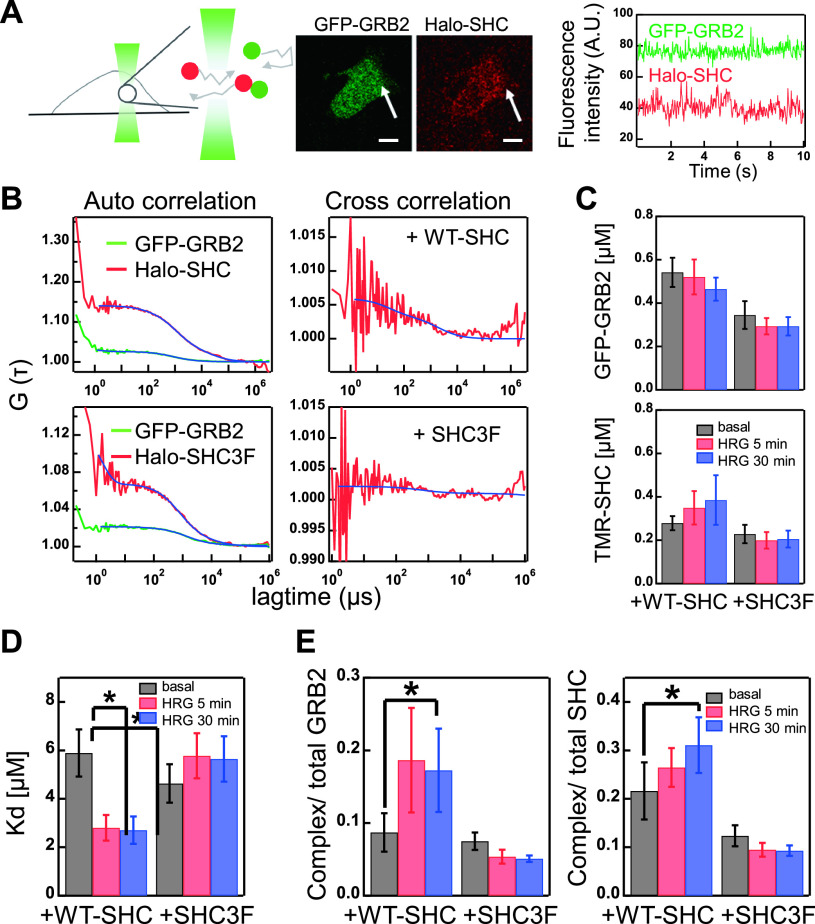
Figure 3 .
Cytoplasm interaction of GRB2 and SHC. (A) Schematic representation of FCCS measurement (left) and fluorescence micrographs of a cell co-expressing GFP-GRB2 and Halo-SHC (middle). Fluctuations in the fluorescence intensities (count rate) in a detection area (arrows in the middle) were detected for FCCS analysis (right). Scale bar, 10 μm. (B) Typical autocorrelation (left) for GFP-GRB2 (green) and Halo-SHC (red), or cross-correlation (right) curves in the same detection volumes. Curves were fitted (blue lines) with functions described in the Methods section. (C) The relative concentrations of GFP-GRB2 (upper) and Halo-SHC (WT or 3F, lower) were determined from the autocorrelation curves. (D, E) The dissociation constant (Kd) of GRB2/SHC complex (D) and fraction ratios of the complex to the total GRB2 or SHC levels (E) were calculated from the FCCS analysis. The mean values for 14–16 cells are plotted along with the standard errors. Asterisks denote statistical significance (p<0.05 using the t test).

