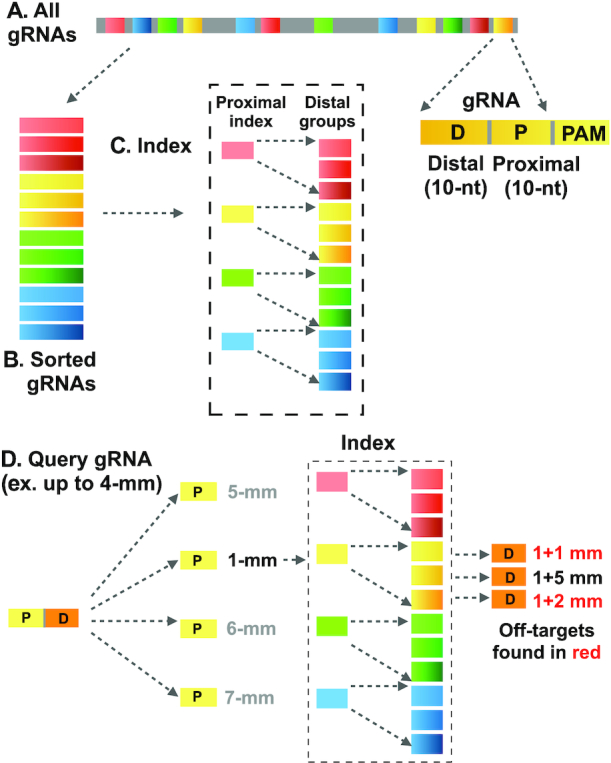
Figure 1.

Schematic of CRISPR-SE: (A) CRISPR-SE scans all of the 20-nucleotides (20-mer) gRNAs; (B) sort all gRNAs by the proximal region (10-nt close to PAM sequence); (C) Group gRNAs with the same proximal regions. (D) Calculate the mismatches in the proximal region; add the mismatches in the distal region only with similar proximal region. Using this approach, a query gRNA are virtually compared with all gRNAs.
