Figure 1.
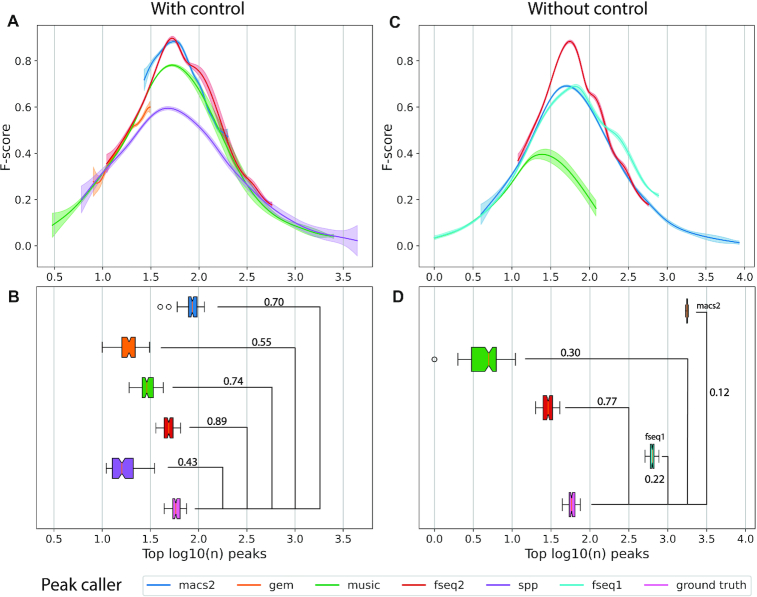
Comparison of peak callers on 100 pairs of simulated transcription factor ChIP-seq datasets. (A) The F-score operating characteristic curve where F-score is plotted as a function of the log10 top number of peaks called with control data. Generalized additive models are used to estimate the mean and 95% confidence intervals (shaded areas) of 100 peak calling results for each peak caller. (B) Boxplot of the number of peaks called by each peak caller with default threshold with control data, and the number of significant peaks in ground truth. Numbers are shown in log10 scale. Pearson’s correlation coefficient  is shown above the bridge linking peak caller and ground truth. (C) The F-score plot without control data. SPP was not able to run without control. GEM resulted in few peaks which is not shown in the plot. (D) Boxplot without control data.

