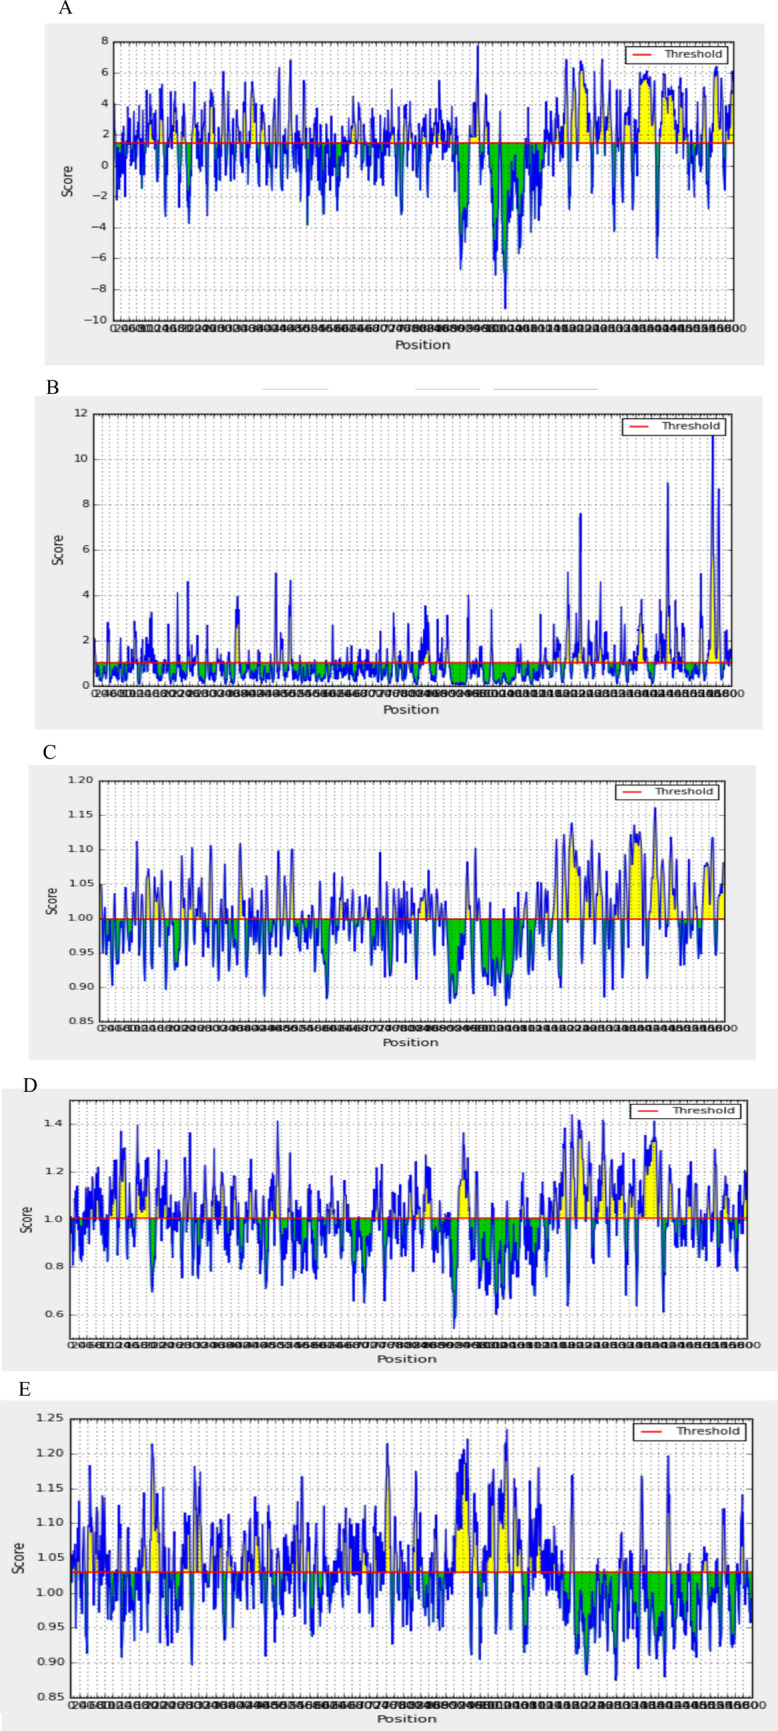
Fig. 3.

Graphical representation of B cell epitopes prediction by a Parker hydrophilicity prediction (threshold: 1.474), b Emini surface accessibility prediction (threshold: 1.000), c Karplus and Schulz flexibility prediction (threshold: 0.999), d Chou and Fasman beta turn prediction (threshold: 1.004) and e Kolaskar and Tongaonkar Antigenicity (threshold: 1.0). The yellow regions above the threshold (red line) are supposed to be a part of B cell epitope whereas the green areas are not (Color figure online)
