
Figure 1.
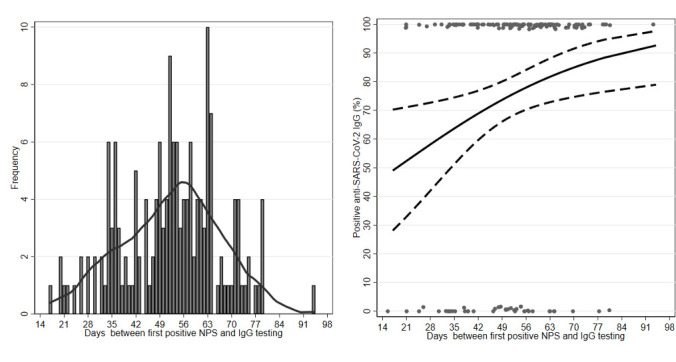
Number of IgG tests (left panel) and percentage of positive IgG tests (right panel) in 162 subjects with a positive nasopharyngeal swab (NPS) prior to serological testing, according to days elapsed since day of first positive NPS. Left panel shows histogram and kernel density smoothing line. In right panel circles indicate subjects with negative (lower circles, n=41) or positive (upper circles, n=121) anti-SARS-CoV-2 IgG, solid and dashed lines are the predicted percentages calculated with a logistic regression model, and dashed lines are 95% bands around the predicted.