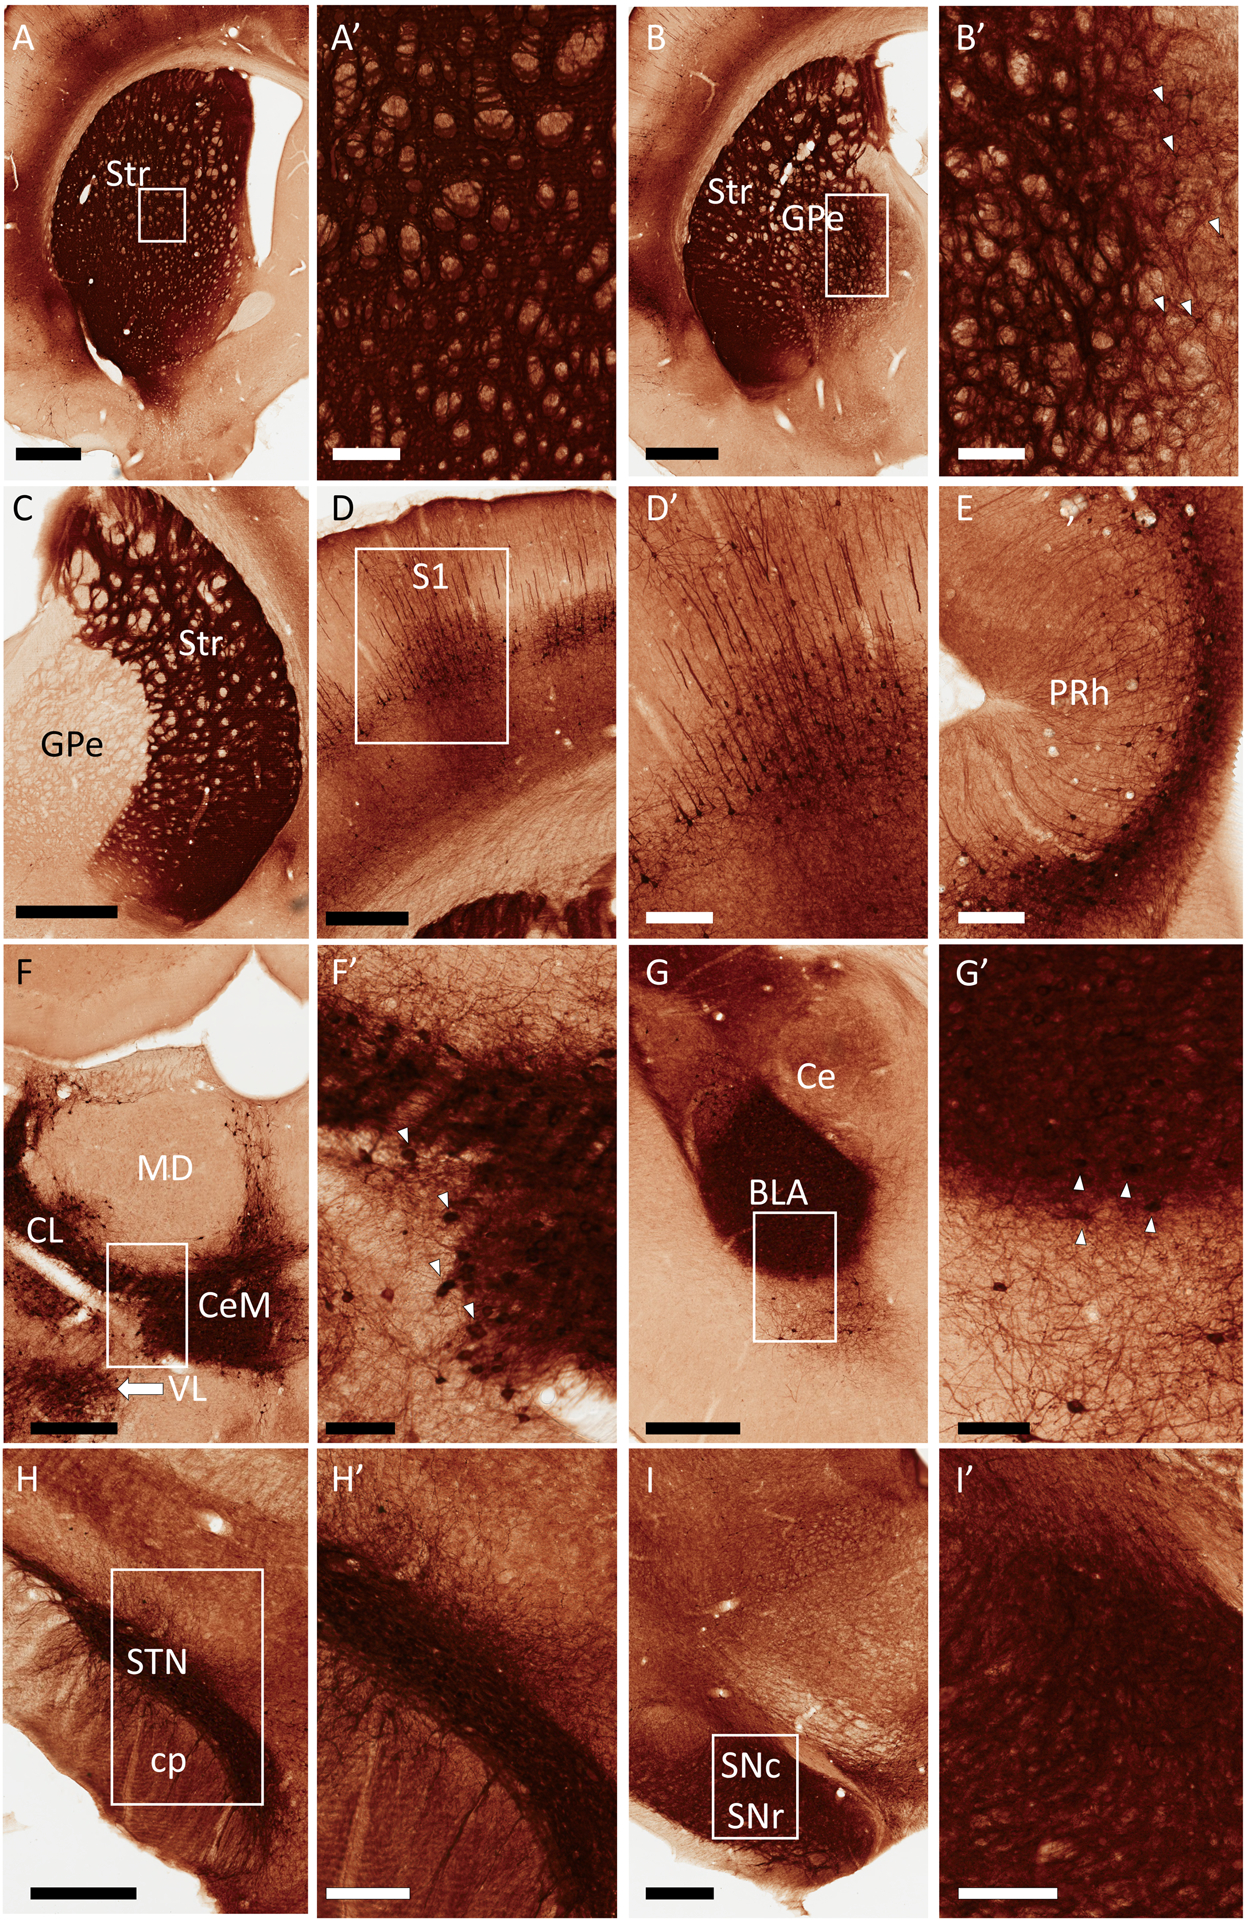
Figure 1:

Representative light micrographs of GFP expression in rat brain following a unilateral, intra-striatal injection of rAAV2-retro-hSyn-Jaws-GFP. All regions shown are from the hemisphere ipsilateral to the virus injection, except where indicated. Areas in rectangles are shown at higher magnification in the corresponding panels labeled with prime symbols. (A) Striatum (Str), (B) External globus pallidus (GPe), (C) GPe, contralateral side, (D) Ipsilateral primary somatosensory cortex (S1), (E) Perirhinal cortex (PRh), (F) Thalamus, (G) Amygdala, (H) Subthalamic nucleus (STN), (I) Substantia nigra. Additional abbreviations: basolateral amygdala (BLA), central amygdala (Ce), centrolateral thalamus (CL), central medial thalamus (CeM), cerebral peduncle (cp), mediodorsal thalamus (MD), substantia nigra pars reticulata (SNr), substantia nigra pars compacta (SNc), ventrolateral thalamus (VL). Arrowheads in B’, F’ and G’ point to subsets of GFP+ cell bodies visible in these panels. GFP+ cells were also numerous in the STN, and also present in the SNc, although the intensity of neuropil labeling in these regions rendered such cell bodies difficult to display by these peroxidase images (see Figs. 3 and 4 for evidence of cell labeling in the rat SNc and STN, respectively). Scale Bars: 1mm (A, B, C); 500μm (D, G, H, I); 300μm (F); 200μm (A’, B’, D’, E, H’, I’); 100μm (F’, G’). Approximate rostrocaudal coordinates of sections, according to (Paxinos & Watson, 2006) in mm relative to Bregma: 1.2 (A); −0.84 (B, C, D); −4.44 (E); −2.52 (F); −3.36 (G); −3.6 (H); −6.12 (I). Figure includes micrographs from all 3 rats used in this study.
