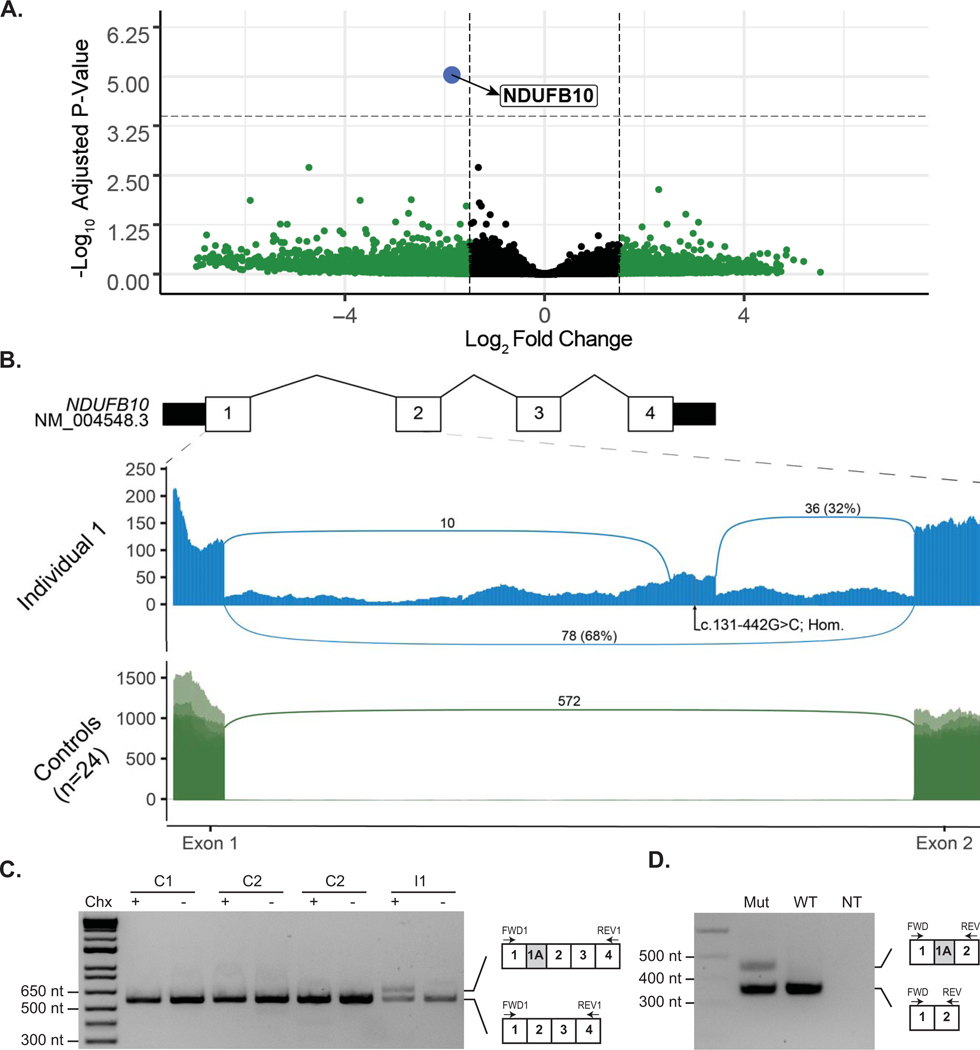
Figure 1. Identification of reduced expression and aberrant splicing in Intron 1 of NDUFB10 in RNA sequencing data from Individual 1.
(A) Analysis of RNA sequencing data revealed significantly decreased expression of NDUFB10 in the affected individual compared to 24 similarly sequenced controls. Dashed lines represent a Log2 Fold Change (L2FC) cut-off of 1.5 or −1.5 on the x-axis and by the log transformed adjusted p-value on the y axis. Details of each gene meeting these thresholds are provided in Supp. Table S6. NDUFB10 is labeled in blue and can be seen as a clear outlier with a L2FC of −1.86 and p-adj = 9.06e-06. Genes colored in green were significant based on their L2FC values as described above while genes color in grey were not significant for their adjusted p-value or for the L2FC value. (B) Sashimi plot depicting junction spanning reads and read depth at each nucleotide from exon 1 to exon 2 of NDUFB10. RNA sequencing data from fibroblasts of Individual 1 (I-1) are shown in the top panel. Two novel splice junctions can be seen, suggesting the presence of a cryptic exon extending between chr16: 1,960,658 – 1,960,751, in intron 1. The position of the homozygous variant, NM_004548.3:c.131–442G>C (NC_000016.10:g.1960711G>C), is shown near the center of the putative cryptic exon. The lower panel displays an overlay of 24 similarly sequenced fibroblast control samples. No reads supporting either of the novel splice junctions were detected in any of the control samples. (C) RT-PCR of NDUFB10 from fibroblast RNA from Individual 1 (I-1) and three control lines (C1, C2 and C3) with (+) or without (−) treatment with cycloheximide (Chx). (D) A mini-gene splicing assay containing the c.131–442G>C was prepared and amplification of RNA from both the mutant and wild-type plasmids by RT-PCR using primers between exon 1 and exon 2 of NDUFB10 yielded an amplicon consistent with the size expected from reference NDUFB10 splicing. In the mutant plasmid, a second larger amplicon was present. This amplicon, approximately 94-nt in size, is absent in the wild-type plasmid and is consistent in size with aberrant splicing event observed on RNA sequencing data.

