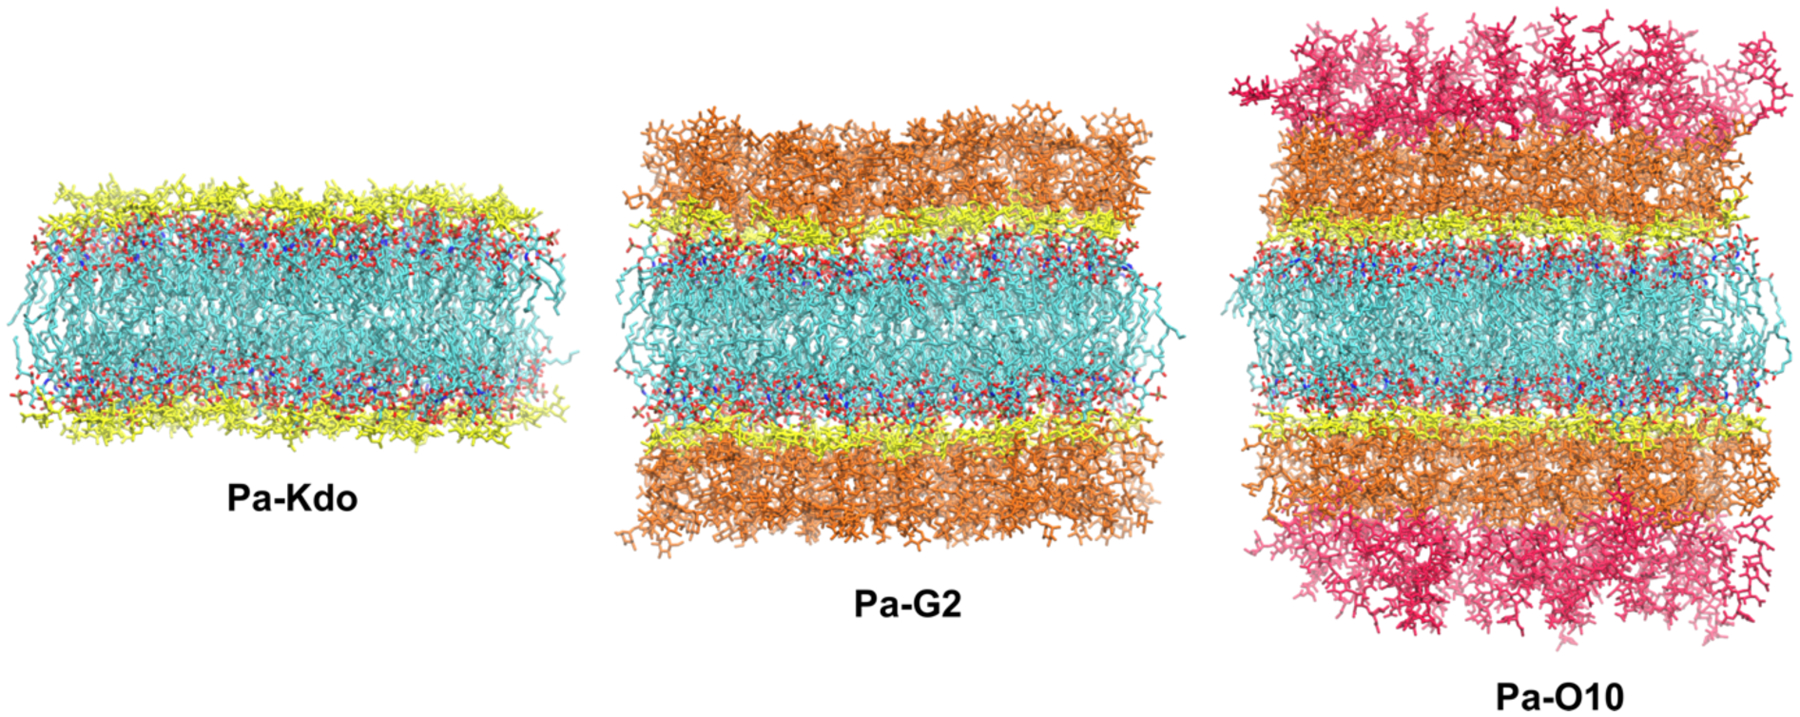
Figure 1.

Molecular graphics snapshots of systems Pa-Kdo, Pa-G2, and Pa-O10. Lipid A in each LPS is colored by atom: cyan for carbon, red for oxygen, blue for nitrogen, and tan for phosphorus. Kdo residues are colored yellow. The G2 core is colored yellow and orange, and two O10 polysaccharide repeating units are colored red.
