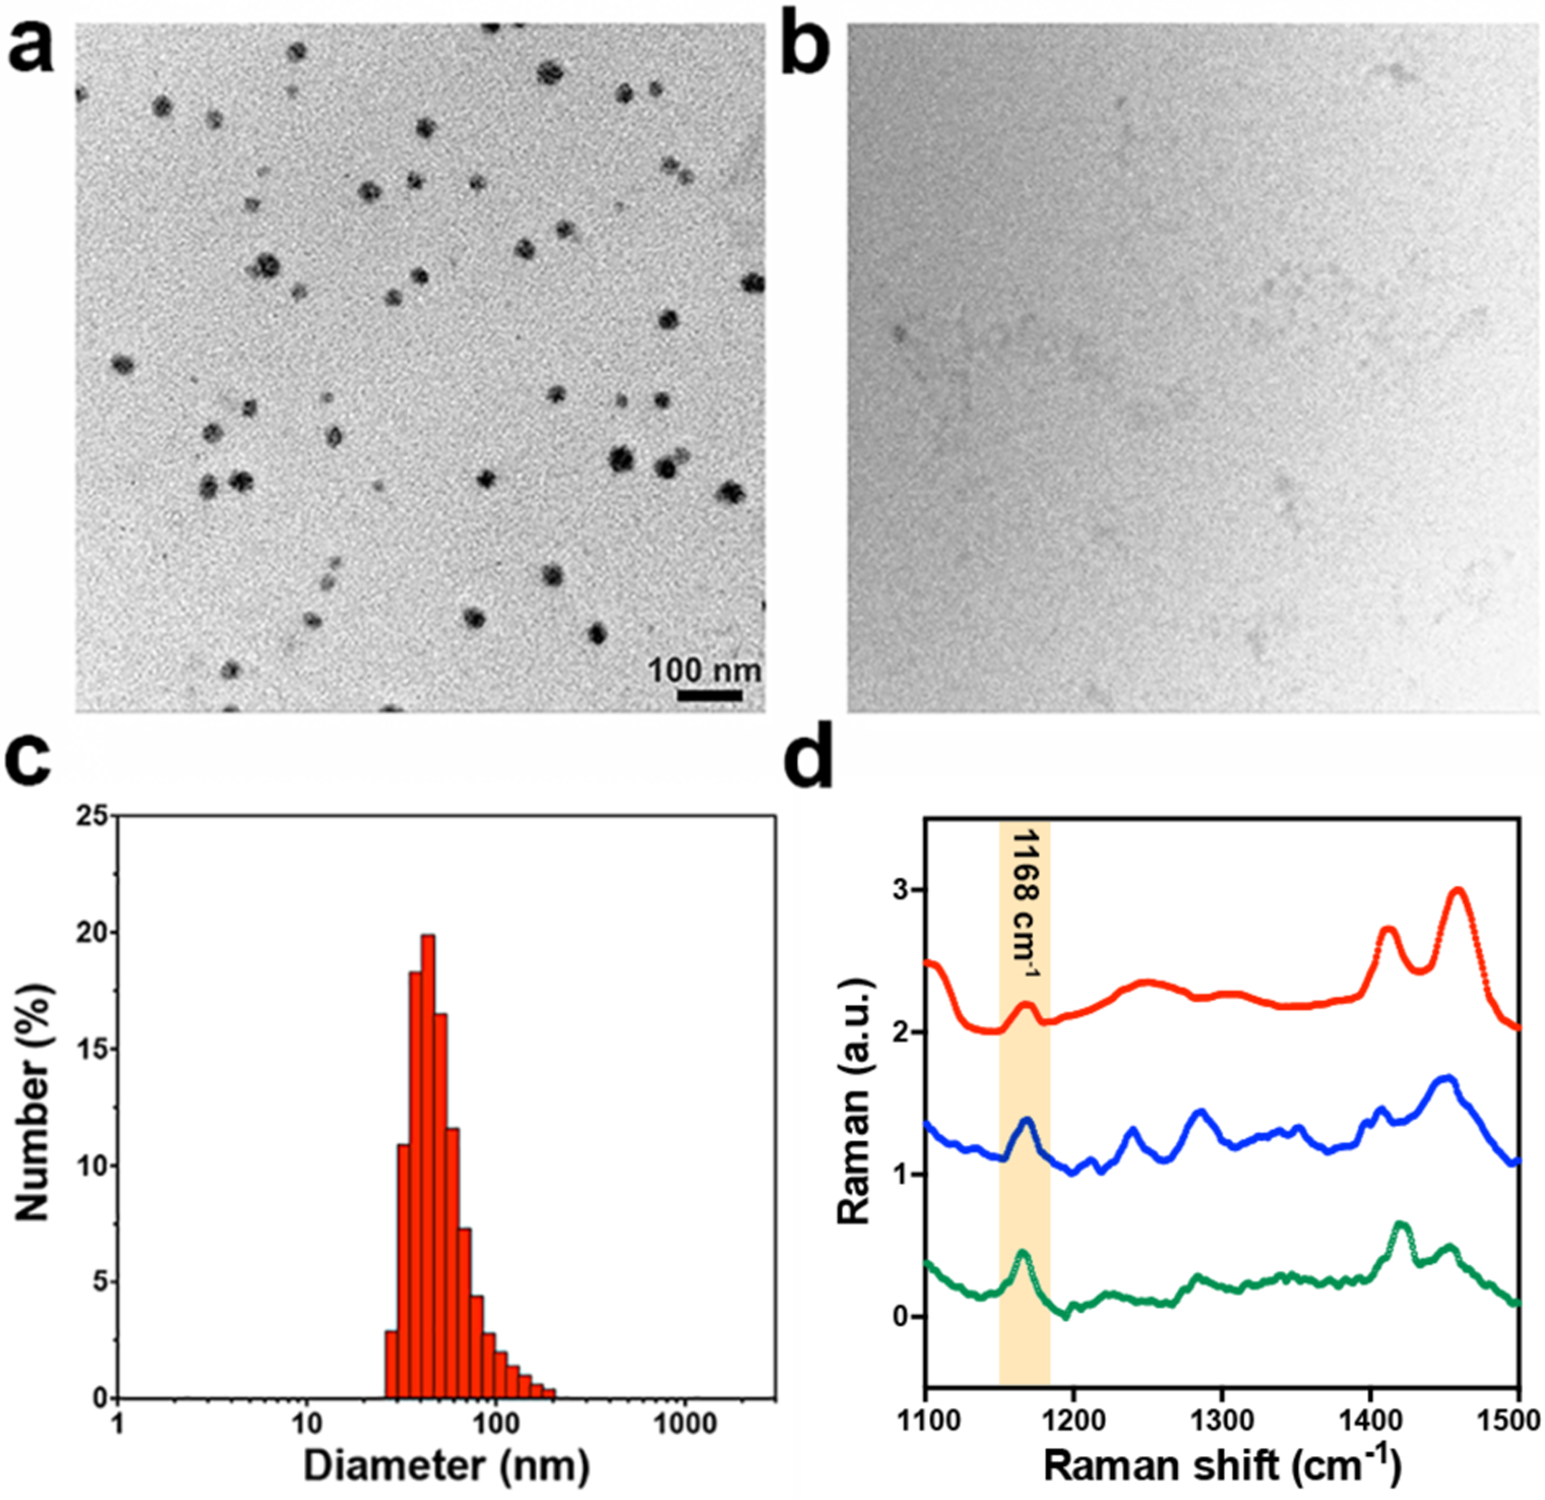
Figure 2.

TEM image of 25 μM Olsa-RVRR after a) and before b) co-incubation of 250 μM GSH and 0.5 nmol U−1 furin for 12 h. c) DLS size distribution of Olsa-NPs after incubation of 25 μM Olsa-RVRR + 250 μM GSH + 0.5 nmol U−1 furin for 12 h. d) Raman spectra of 100 μM Olsalazine (green), 100 μM Olsa-RVRR (blue) and Olsa-NPs (red, obtained by the incubation of 100 μM Olsa-RVRR + 1 mM GSH + 0.5 nmol U−1 furin for 12 h).
