
Figure 4.
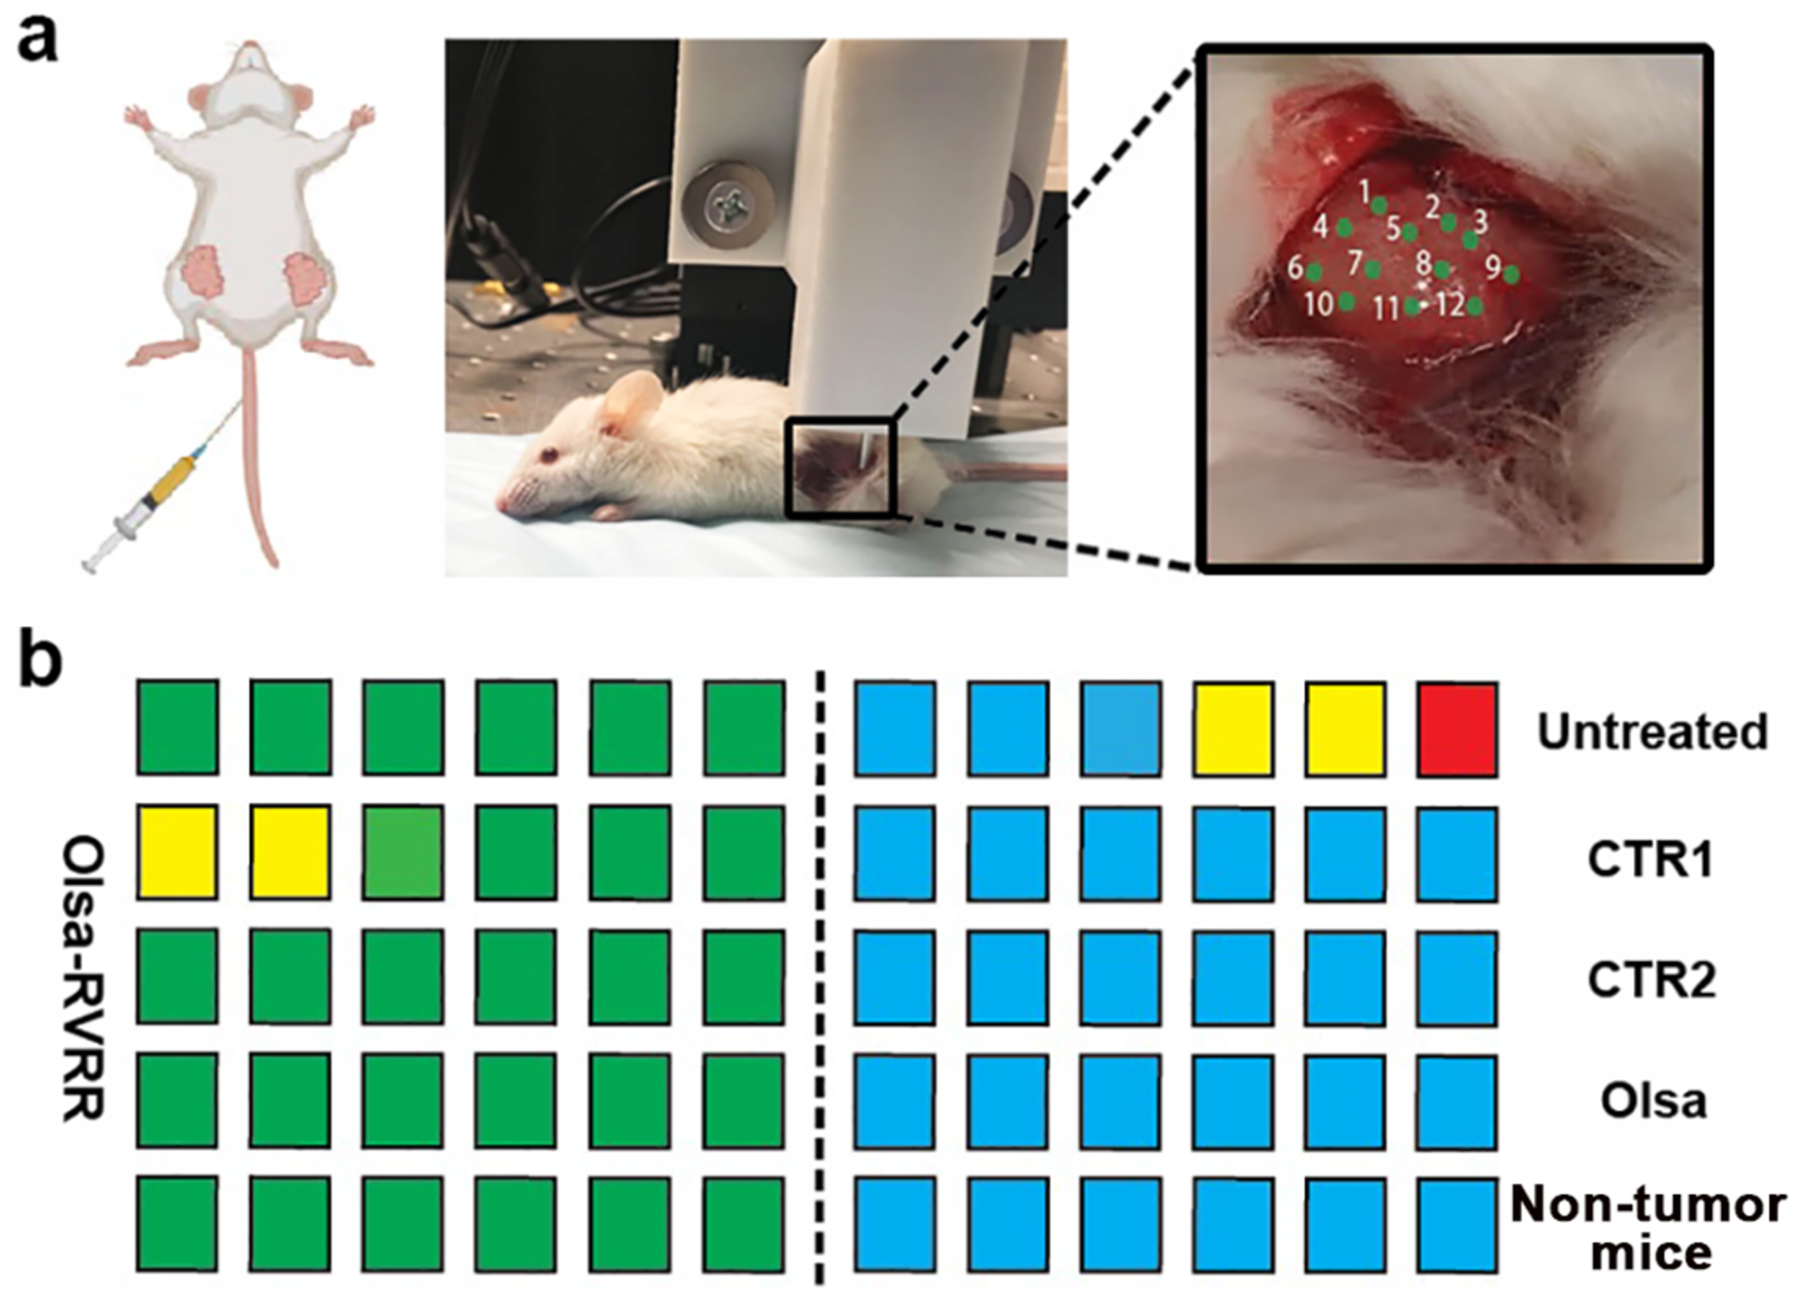
In vivo Raman spectroscopic tumor detection. a) SCID tumor-bearing mice were injected i.v. with different compounds (Olsa-RVRR, CTR1, CTR2, Olsa). Two other groups bore no tumors and were untreated, respectively. Two hours post-injection, the tumor was exposed and Raman spectra were collected using a fiber-optic-based probe from 12 spatially distinct regions as indicated. b) Results of leave-one-tumor-out support vector machine classification of Raman spectra. The predictions are shown for the following binary classification tasks: Olsa-RVRR vs. untreated, Olsa-RVRR vs. CTR 1, Olsa-RVRR vs. CTR 2, Olsa-RVRR vs. Olsa, and Olsa-RVRR vs. non-tumor bearing mice. 6 tumors were included each group in the analyses. The classification results are displayed for on a per-tumor basis. Green box: correctly classified as Olsa-RVRR; blue box: correctly classified as untreated /CTR 1 /CTR 2 /Olsa /or non-tumor mice; red box: misclassified; and yellow box: unclassified.