
Fig. 5.
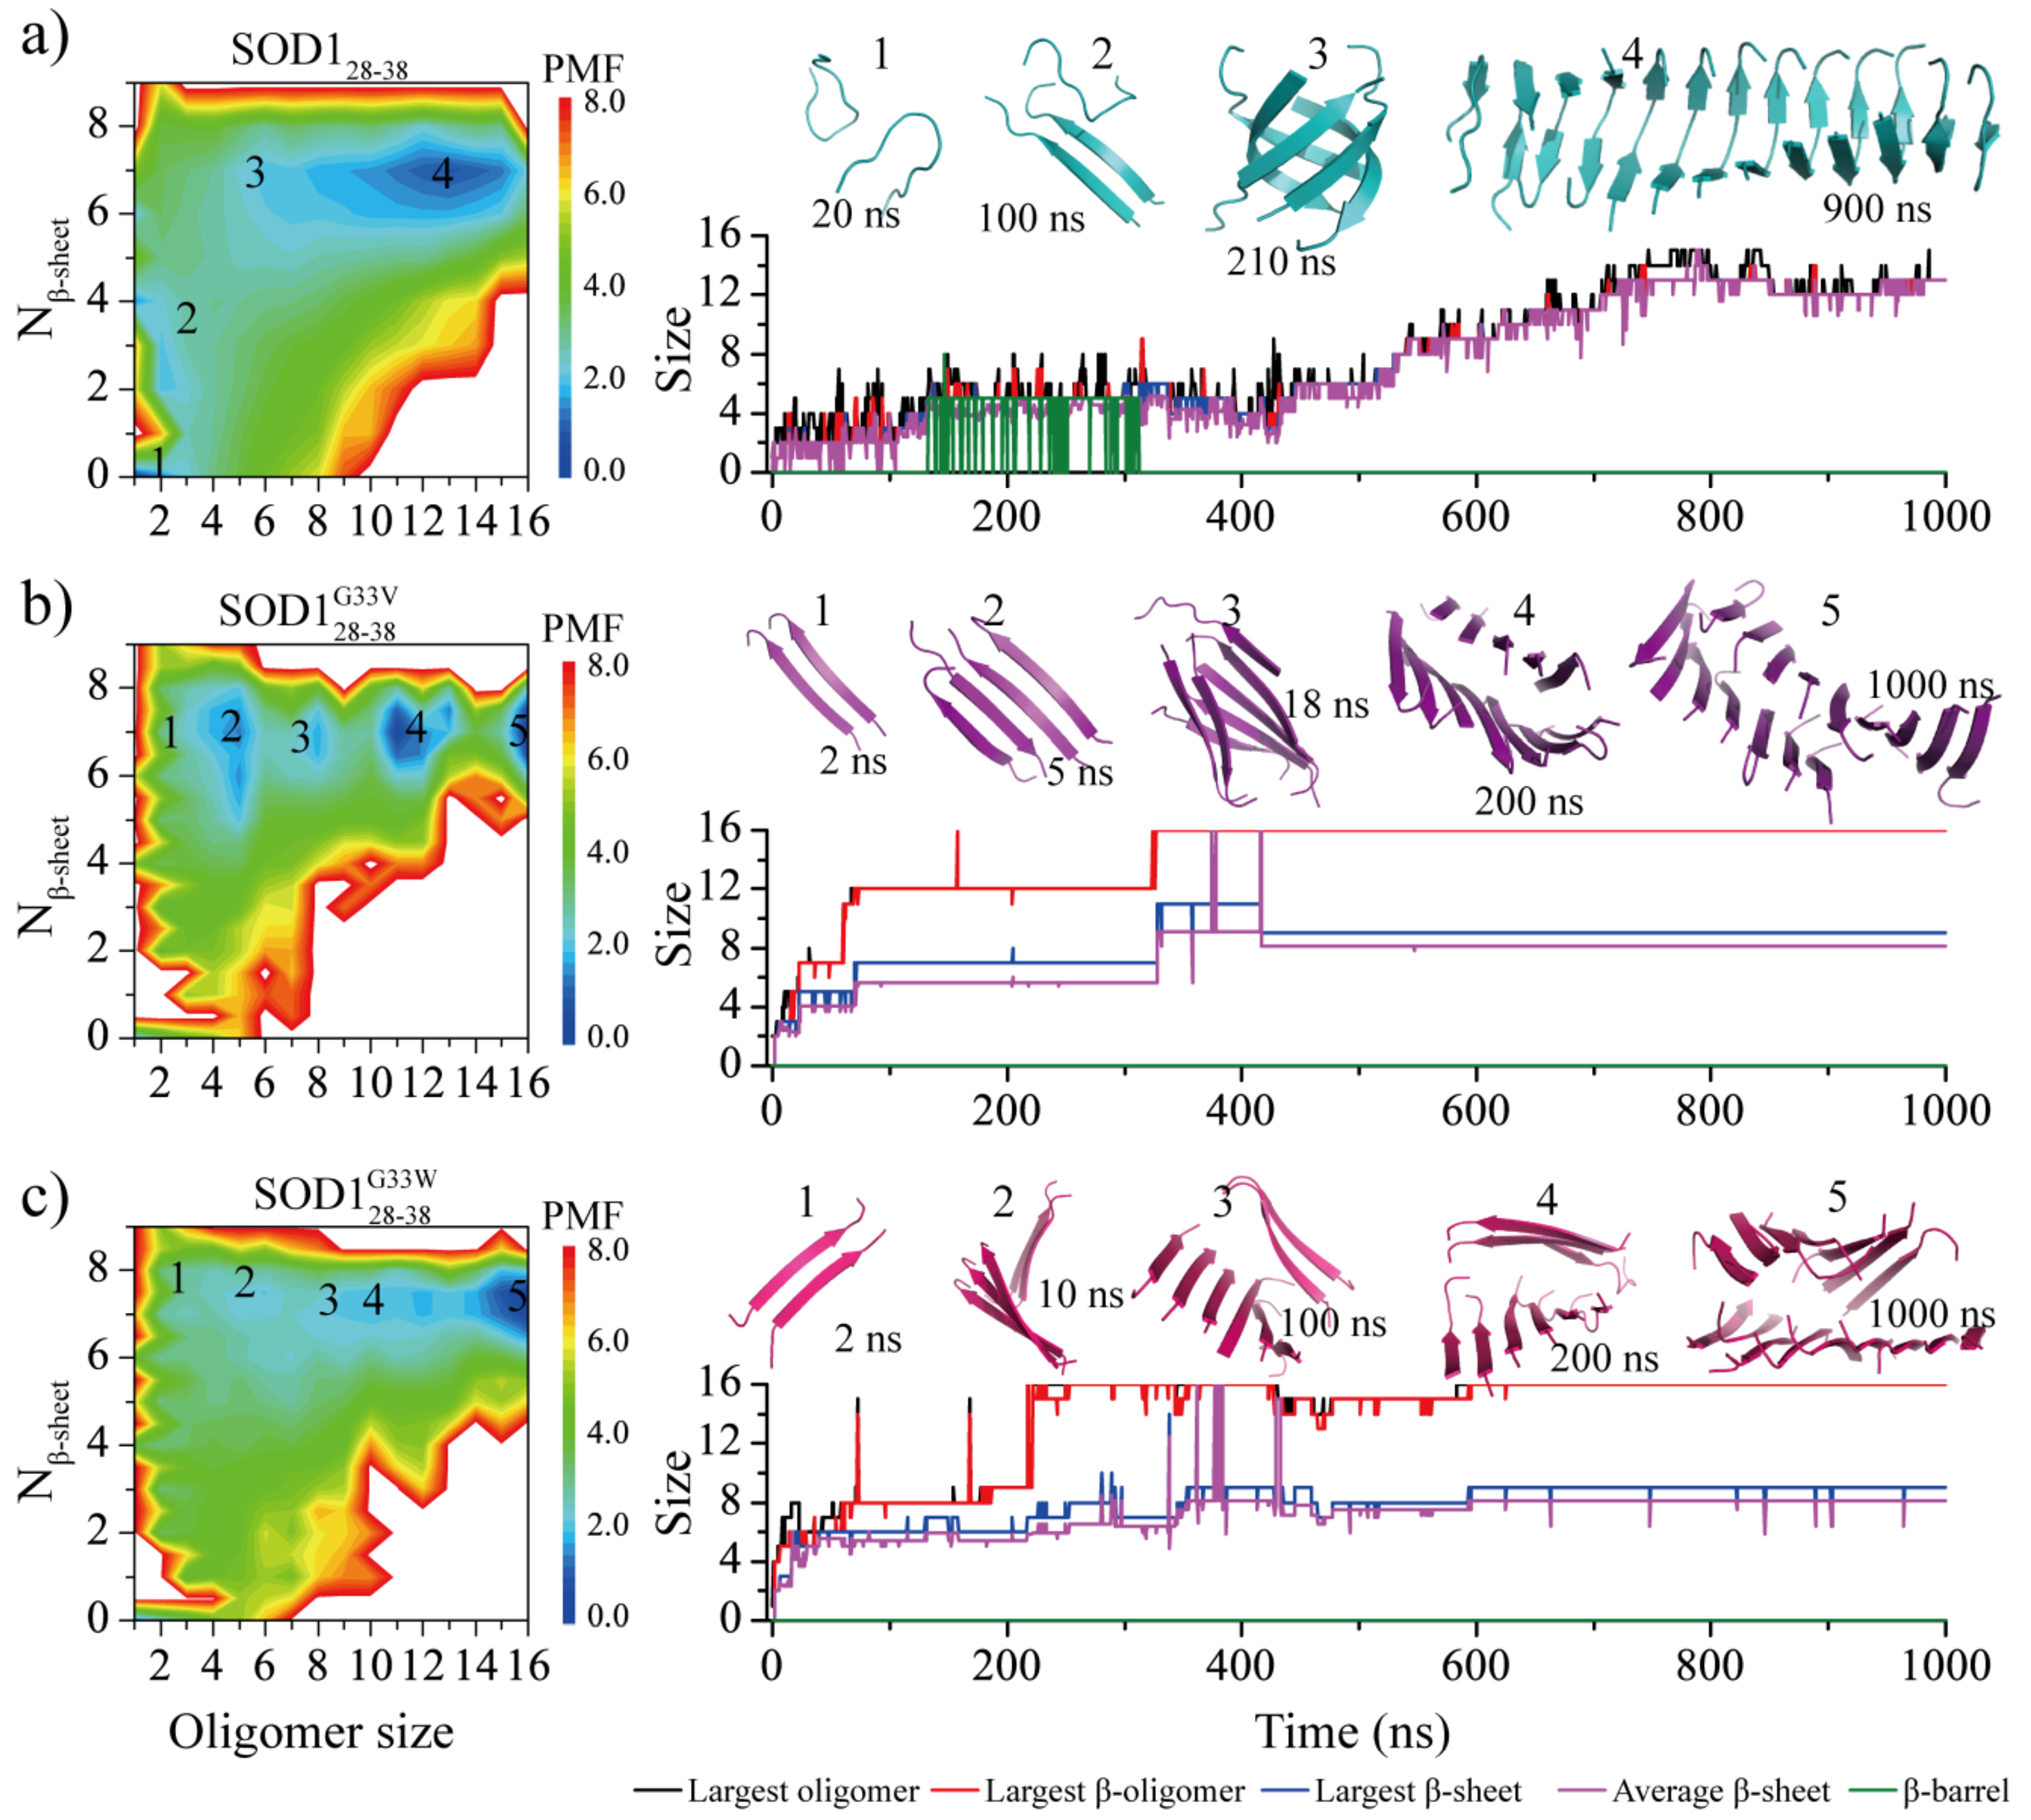
The self-assembly free energy landscape and aggregation dynamics analysis for sixteen-peptide simulations. For each of three peptide types - a) SOD128–38, b) SOD128–38G33V and c) SOD128–38G33W, the free energy landscape as a function of the oligomer size and the average number of residues adopting β-sheet conformation per chain (Nβ-sheet) are presented on the left. To capture all the conformation of assemblies during the aggregation process, the whole 1000 ns trajectory of 20 independent DMD runs were included in the analysis. A representative trajectory from isolated monomers into final nano-fibrils via all the intermediates corresponding to labeled basins in the PMF is also shown on the right. The size of the largest oligomer (black), largest β-sheet oligomer (red), largest β-sheet layer (blue), averaged β-sheet layer (purple) and β-barrel (green) are plotted as a function of simulation time. The snapshots along with the growth of assemblies are also shown in the inset on the right and their corresponding states in the free energy landscape are also labeled. SOD128–38, SOD128–38G33V and SOD128–38G33W peptides are colored in cyan, purple and pink, respectively.