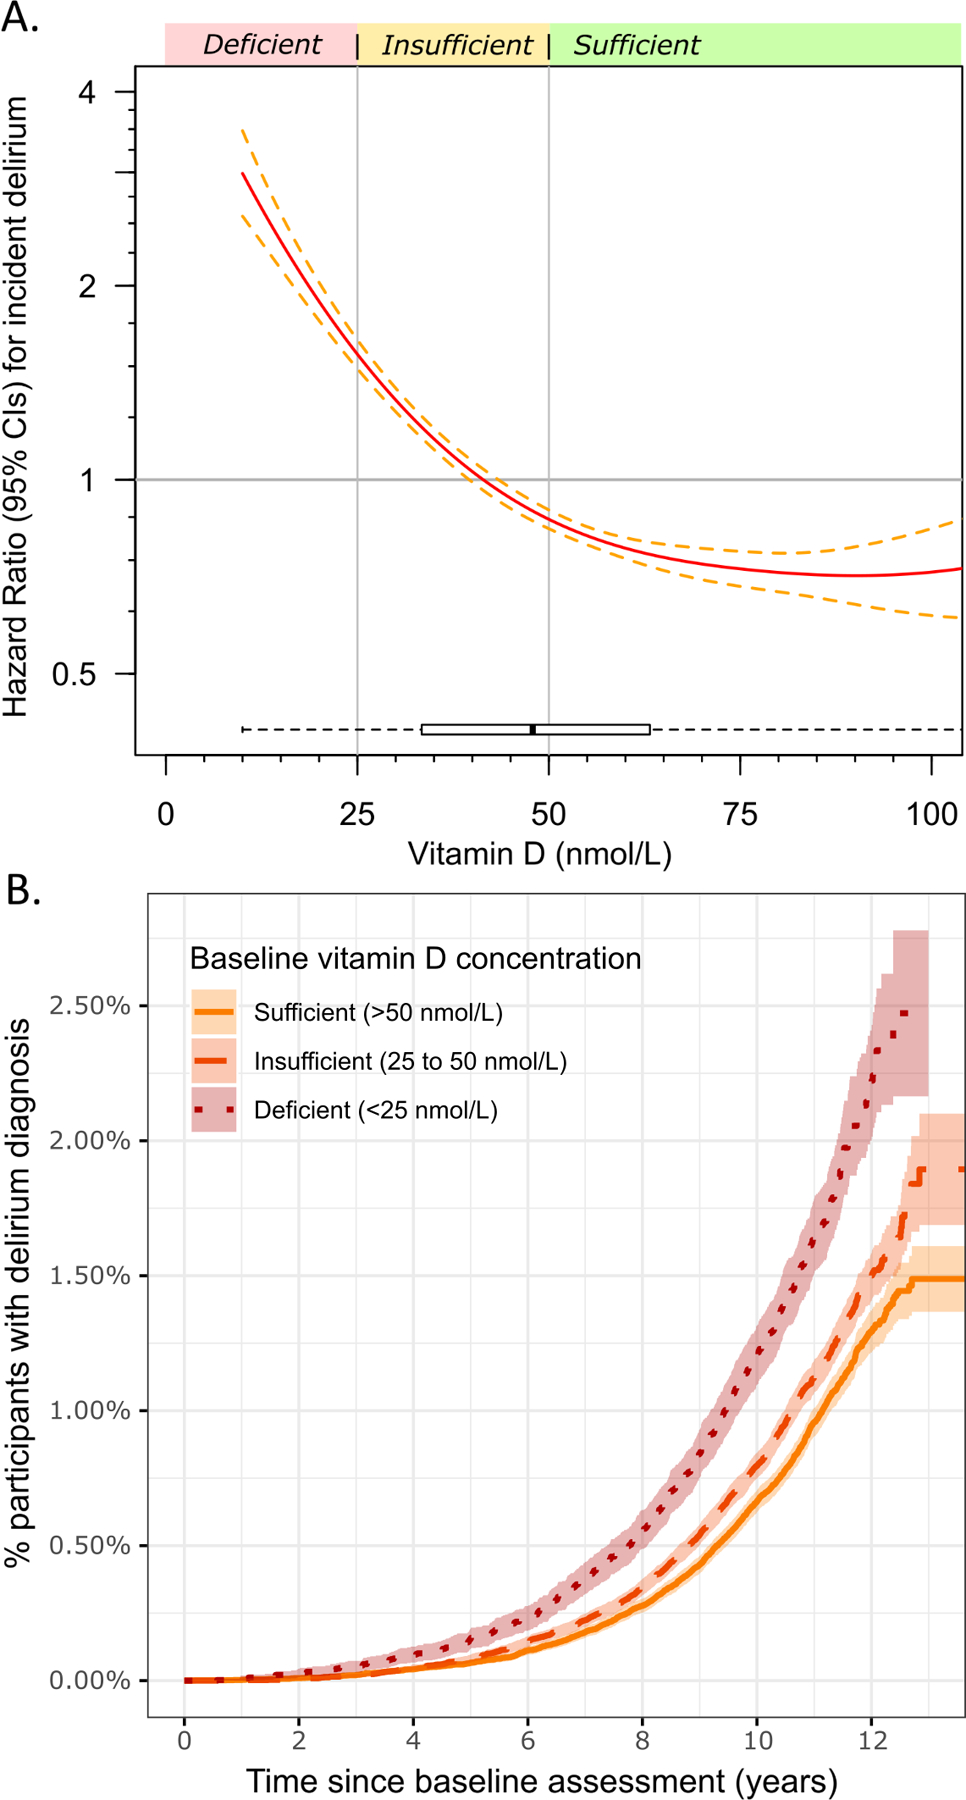
Figure 1: Serum vitamin D and rates of incident delirium diagnosis.

A) Analysis of serum vitamin D (nmol/L) at baseline and rates of incident delirium diagnosis using Cox’s proportional hazards regression models adjusted for age, sex, assessment center, assessment month, and self-reported ethnicity. A smoothing spline function was applied to determine the non-linear effect of vitamin D on risk of incident delirium. The x-axis is limited to 100 nmol/L for clarity, see Supplementary Figure S3 for the unrestricted plot. B) Unadjusted cumulative event plot showing the proportion of the participants with a diagnosis of delirium in the hospital in three groups, based on baseline vitamin D sufficiency. R package `survminer` (v0.4.8) used for plot B).
