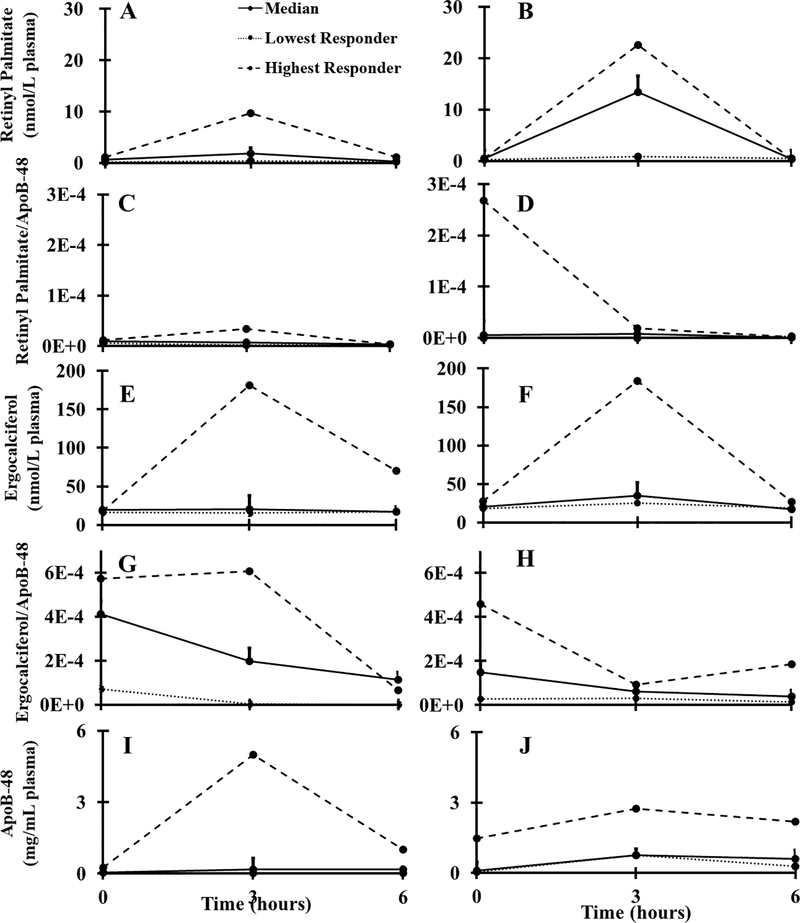
Figure 1.
Postprandial curves from 0–6 h representing average response (n=10 per group), highest-, and lowest-responders for (a) vitamin A healthy, (b) vitamin A MetS, (c) vitamin A normalized to ApoB-48 healthy, (d) vitamin A normalized to ApoB-48 MetS, (e) vitamin D2 healthy, (f) vitamin D2 MetS, (g) vitamin D2 normalized to ApoB-48 healthy, (h) vitamin D2 normalized to ApoB-48 MetS, (i) ApoB-48 healthy, (j) ApoB-48 MetS. MetS, metabolic syndrome; ApoB-48, apolipoproteinB-48.

