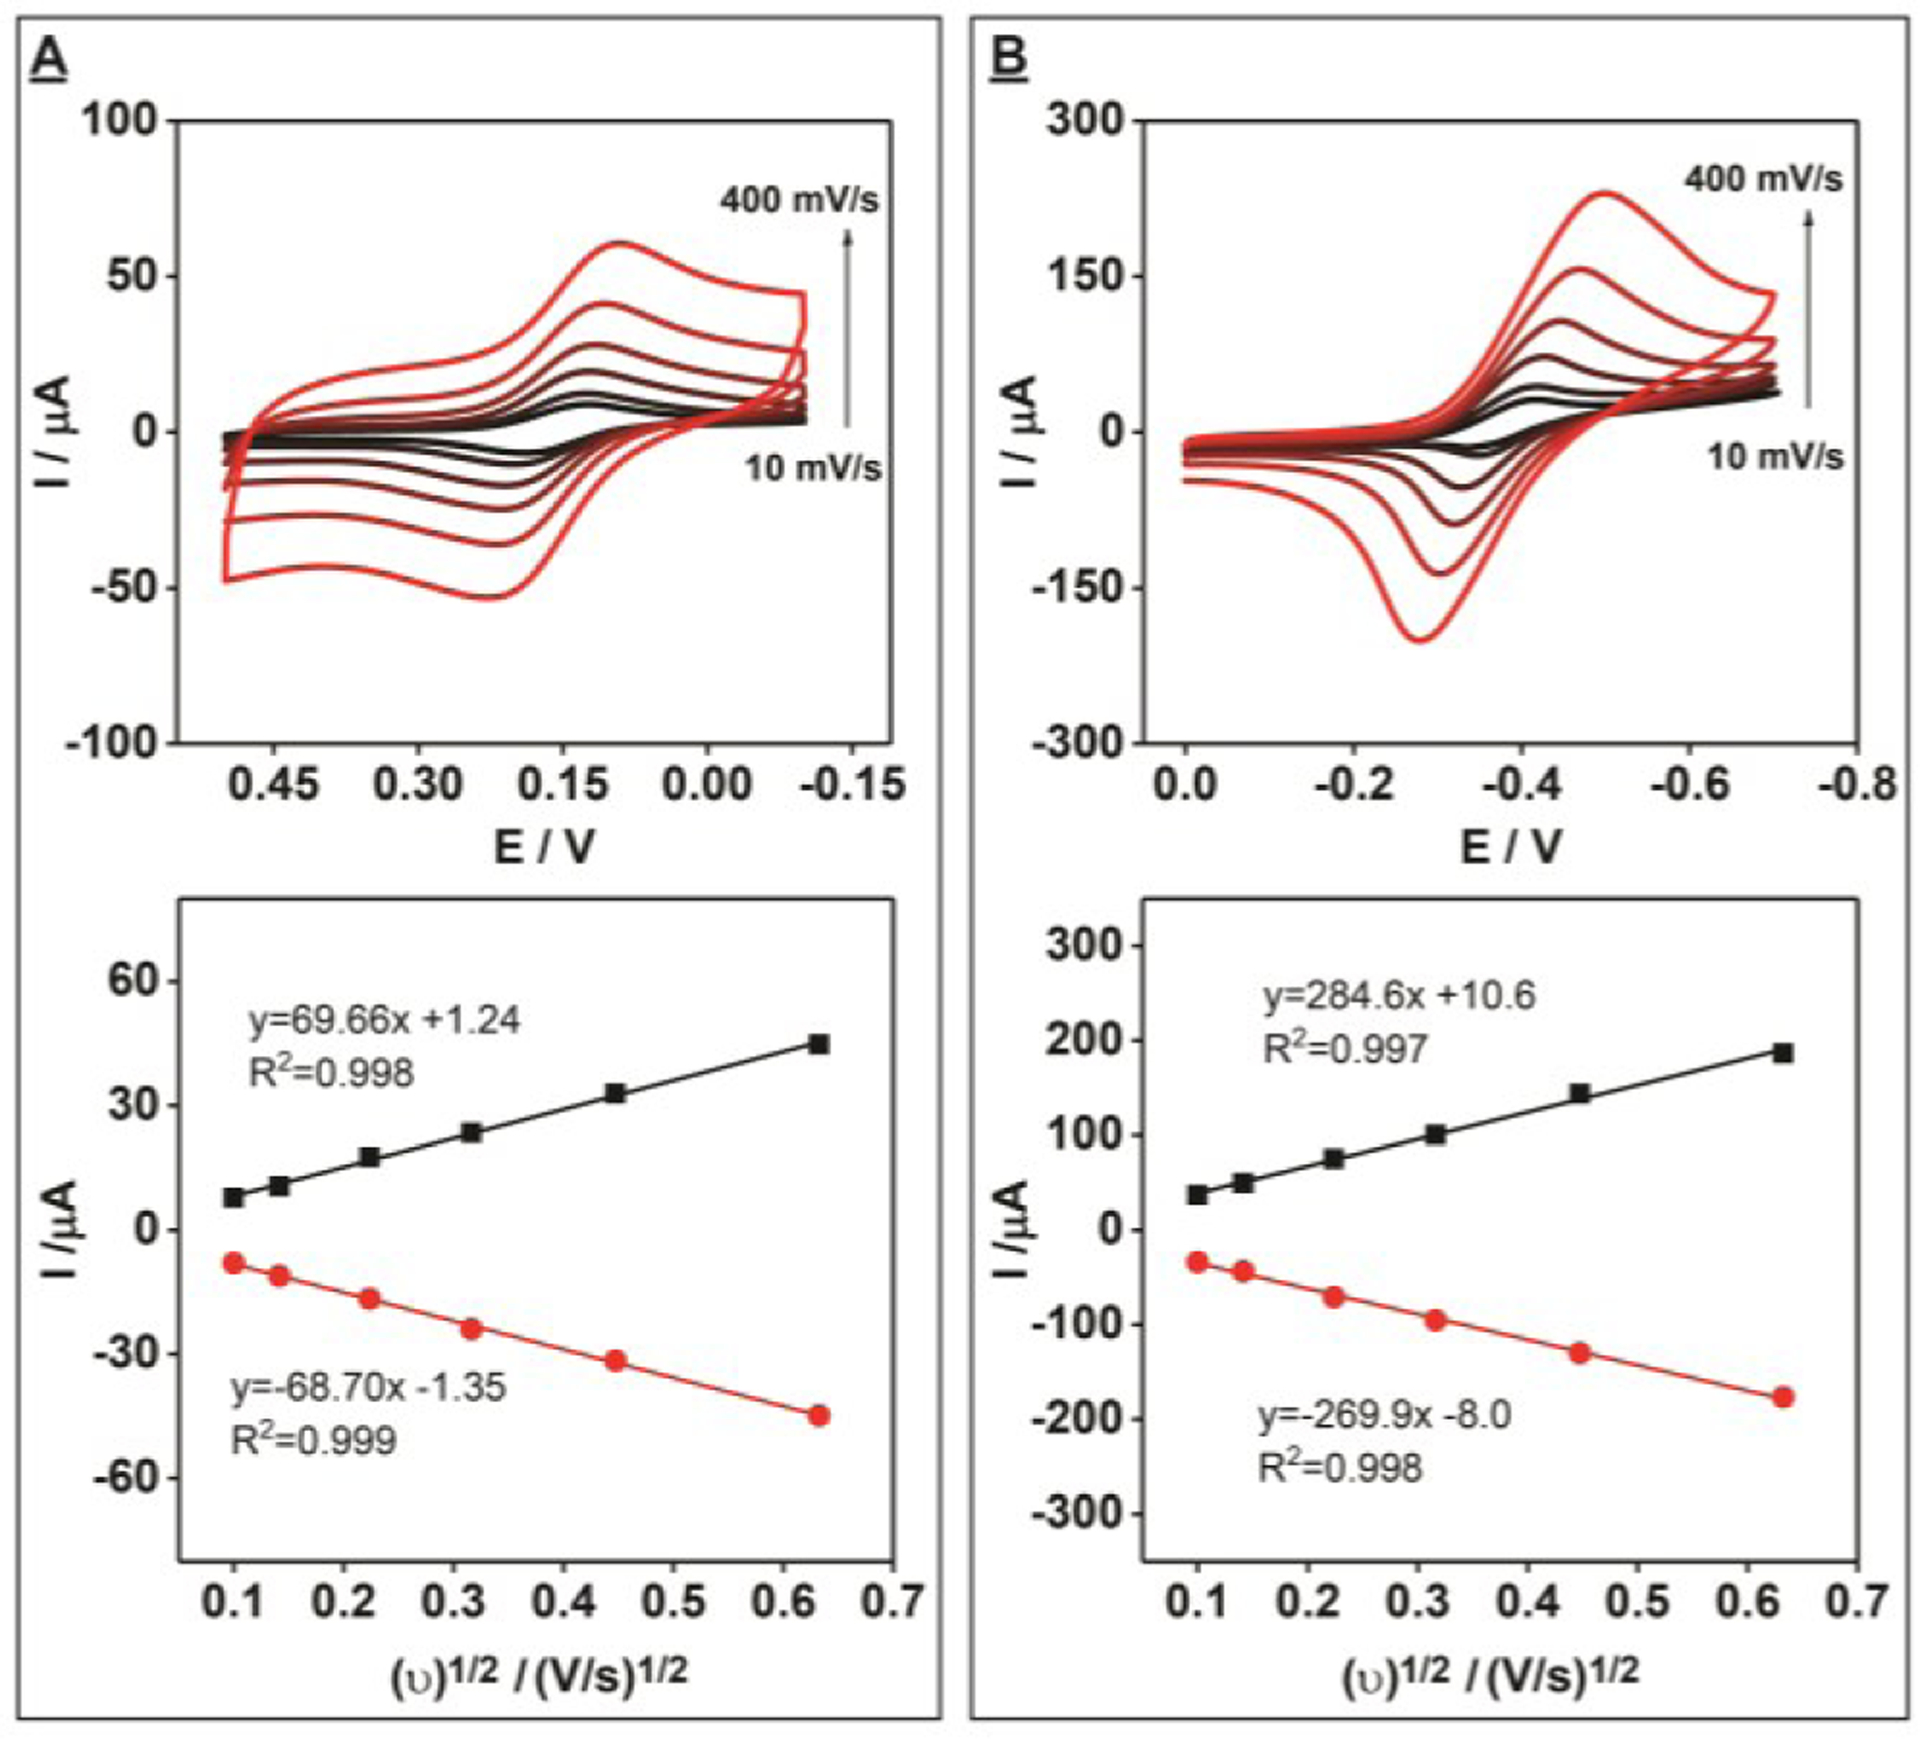
Figure 4.

Electrochemical performance of unmodified PEDs with electroactive small molecules. Cyclic voltammetry scans at different scan rates (top) (increasing scan rate is indicated by the black to red color gradient) and the relationship between the square root of the scan rate and the observed current (bottom) for 1 mM (A) K3[Fe(CN)6] or (B) methylene blue in 0.1 M KCl. Black and red lines indicate oxidation and reduction peak currents, respectively. Scan rates: 10, 20, 50, 100, 200 and 400 mV/s.
