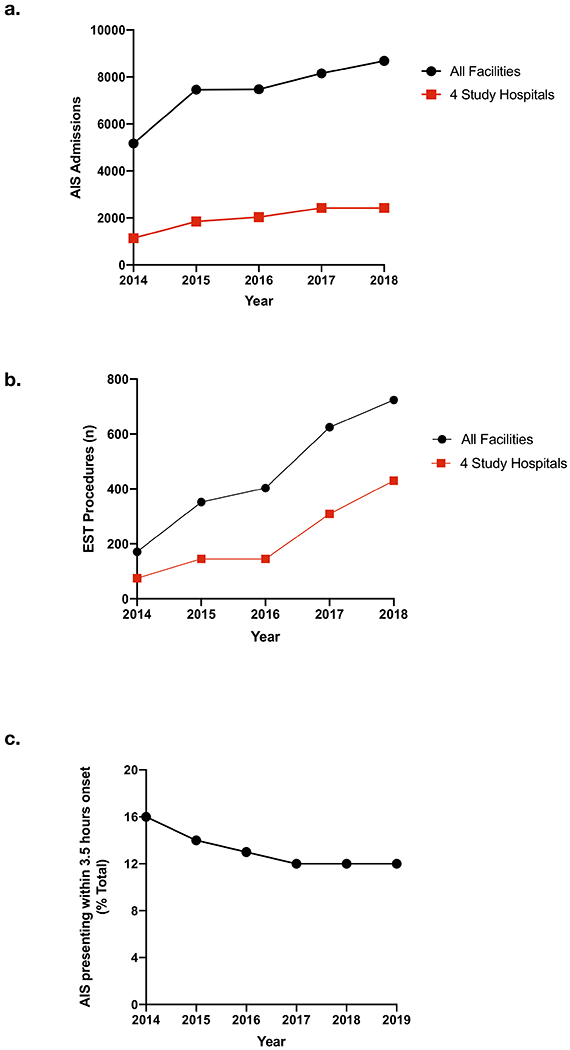
Figure 3. SETRAC regional data.

Total AIS admissions (a) and EVT procedures (b) for all facilities within the two-county region as well as the 4 study hospitals. (c) Percentage of all AIS presenting to a stroke center in the two-county region within 3.5 hours from onset over time.
