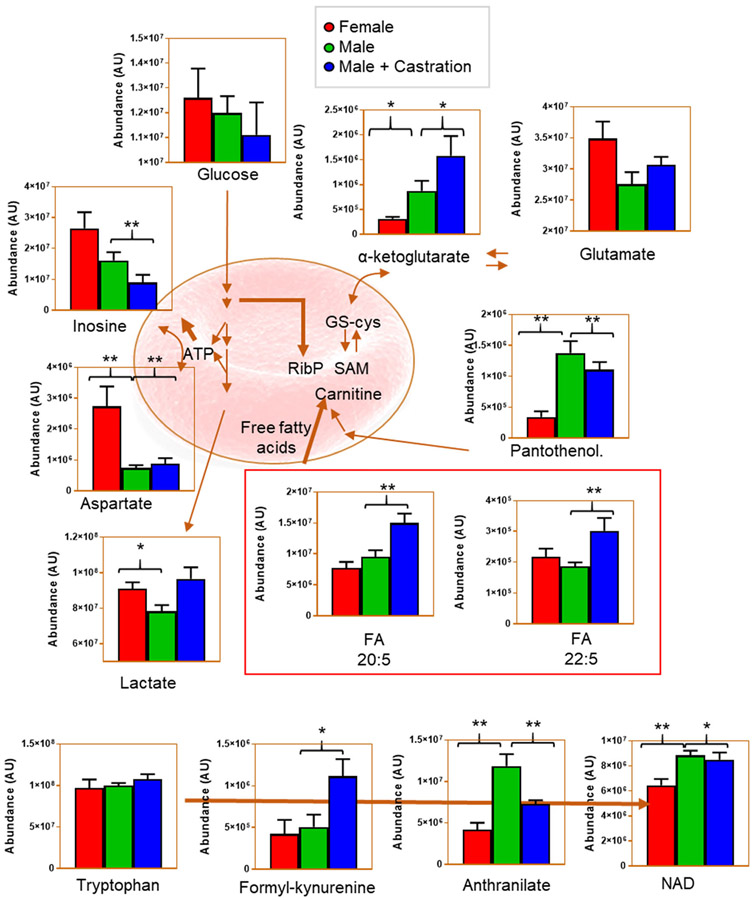
FIGURE 2.
Pathway analysis of RBCs from intact males, females, and orchiectomized FVB/NJ mice. Bar plots (mean ± SEM) highlight the most impacted metabolites and related pathways from metabolomics analysis. Significant (*, P < 0.05, **, P < 0.01) metabolite changes were determined by two-tailed t test

