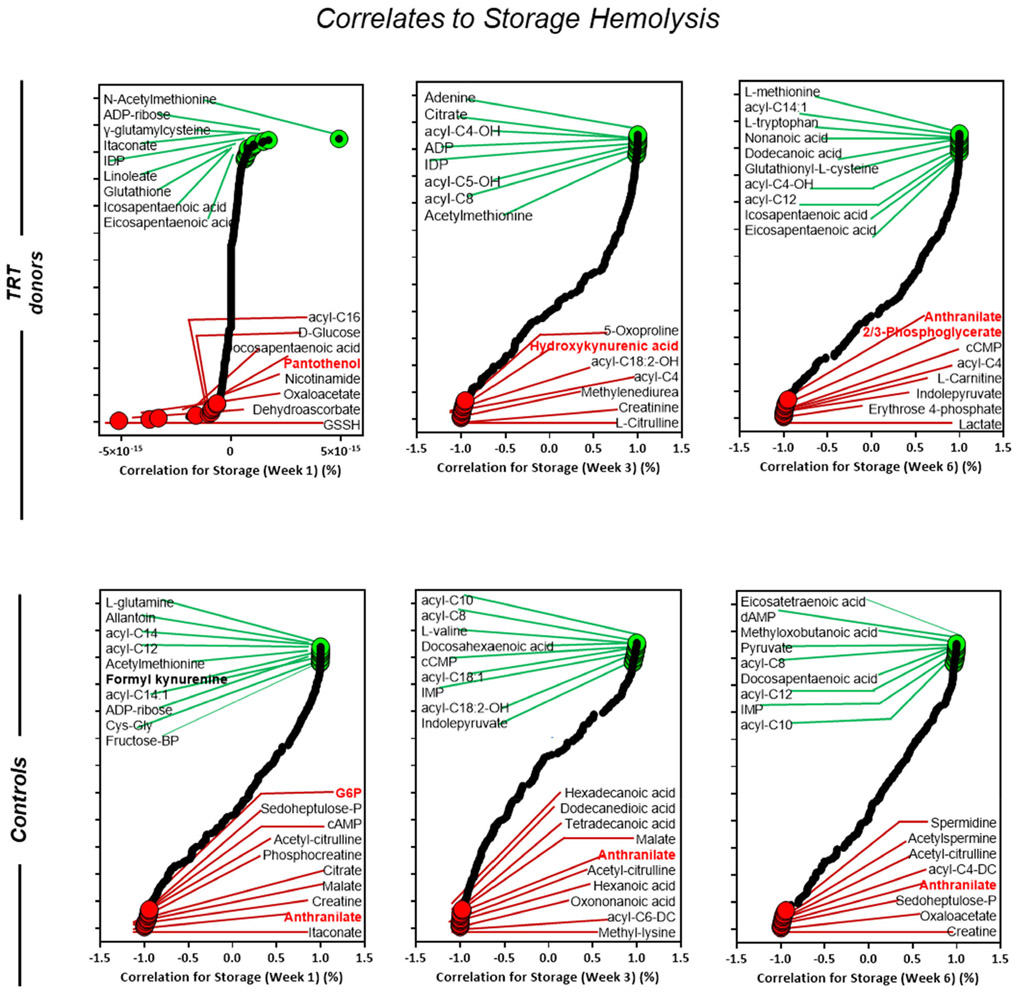
FIGURE 6.
Metabolic correlates of storage hemolysis in blood donors (cohort 2) who received testosterone replacement therapy (TRT) verses their matched controls (no TRT). Correlation curves represent storage weeks 1, 3, and 6. The dot plot highlighted positive (green) or negative (red) metabolic correlates to storage hemolysis. All highlighted metabolites were selected within the top 15 negative and positive correlates

