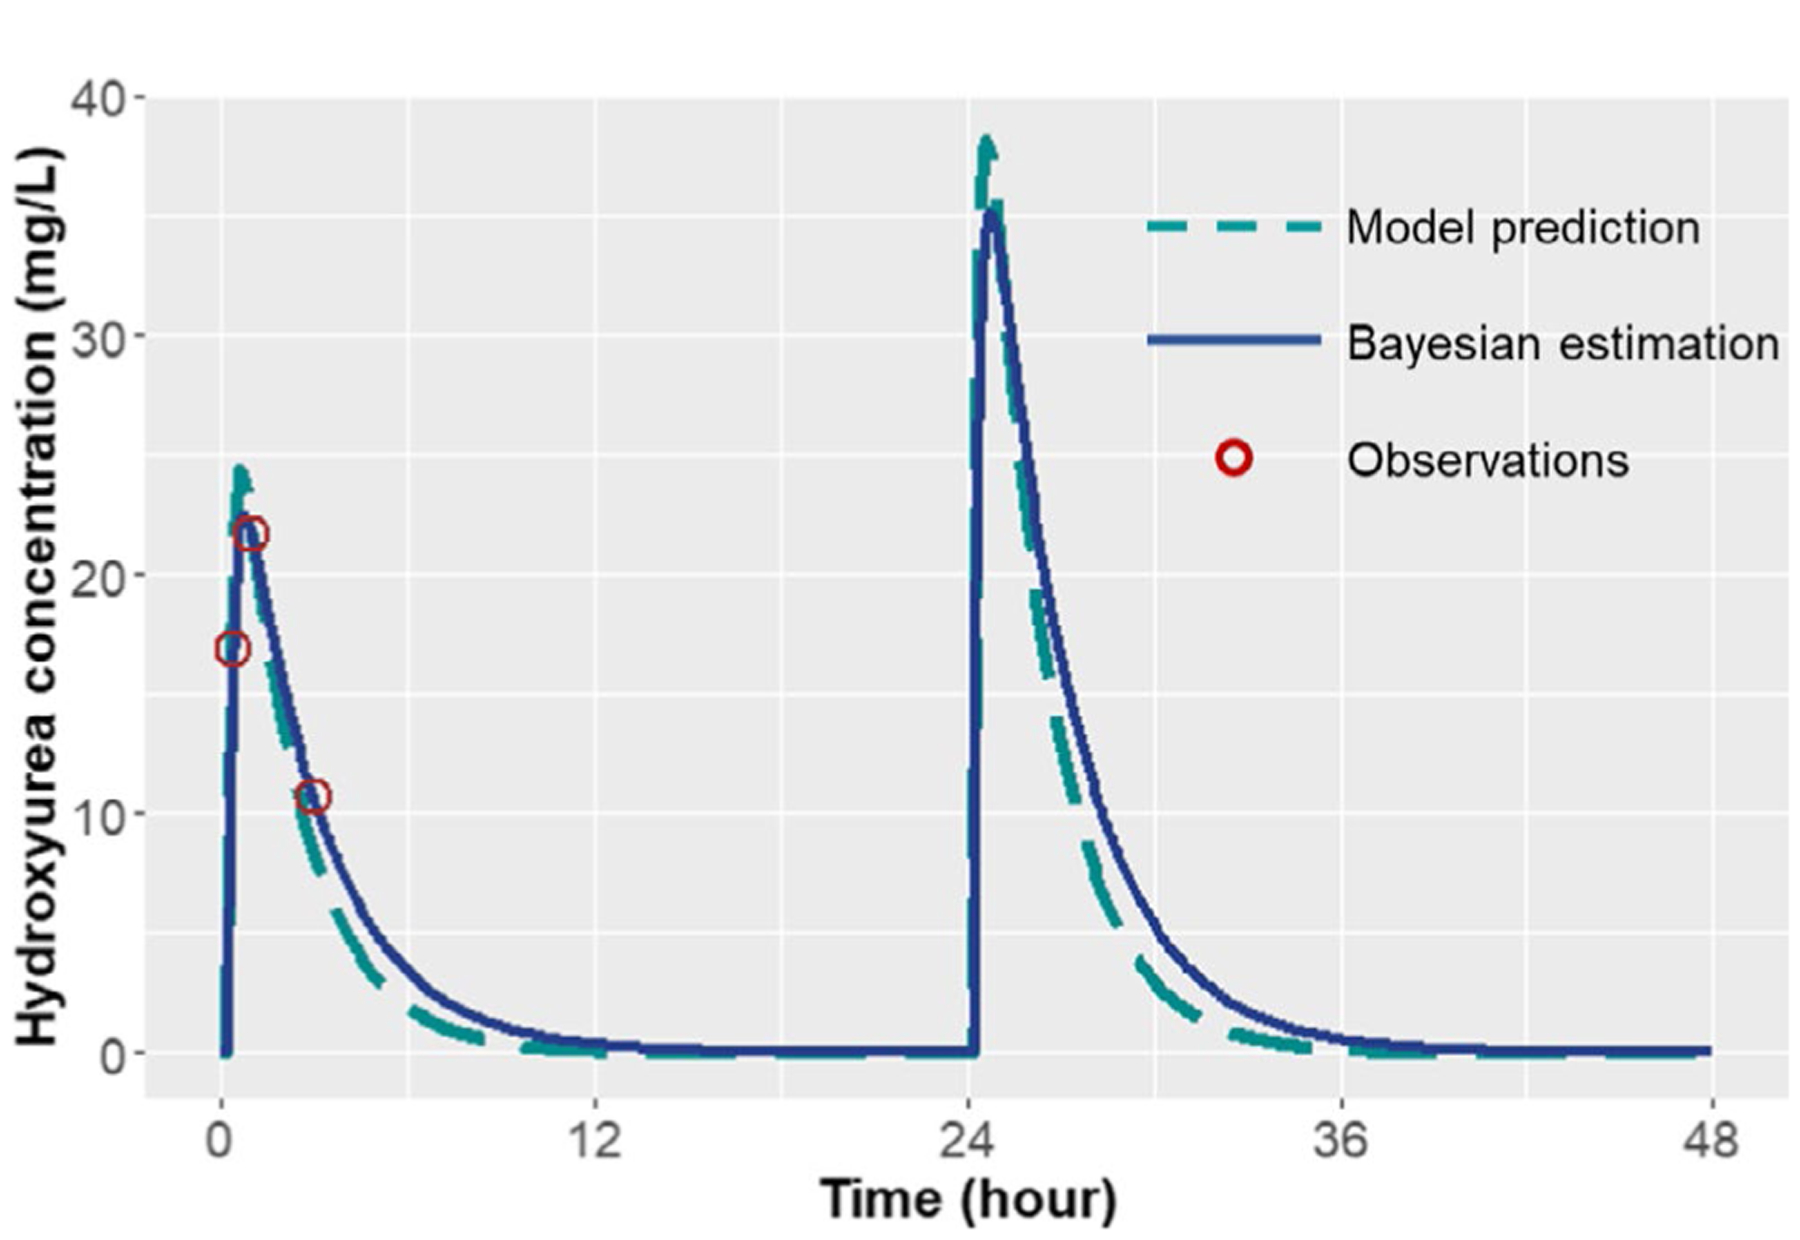
Figure 4.

Bayesian estimation of hydroxyurea pharmacokinetic (PK) profile. The figure illustrates a representative hydroxyurea PK profile re-constructed using Bayesian approach (blue line) vs. population model prediction (teal dashed line). In this young child of 7 months old, Bayesian algorithm generated an area under the concentration-time curve (AUC) prediction of 75 mg*hour/L (blue line), which is slightly different from model prediction (teal dashed line). Based on the exposure target of 115 mg*hour/L, an optimal starting dose of 30.2 mg/kg was selected to achieve the target.
