Figure 1.

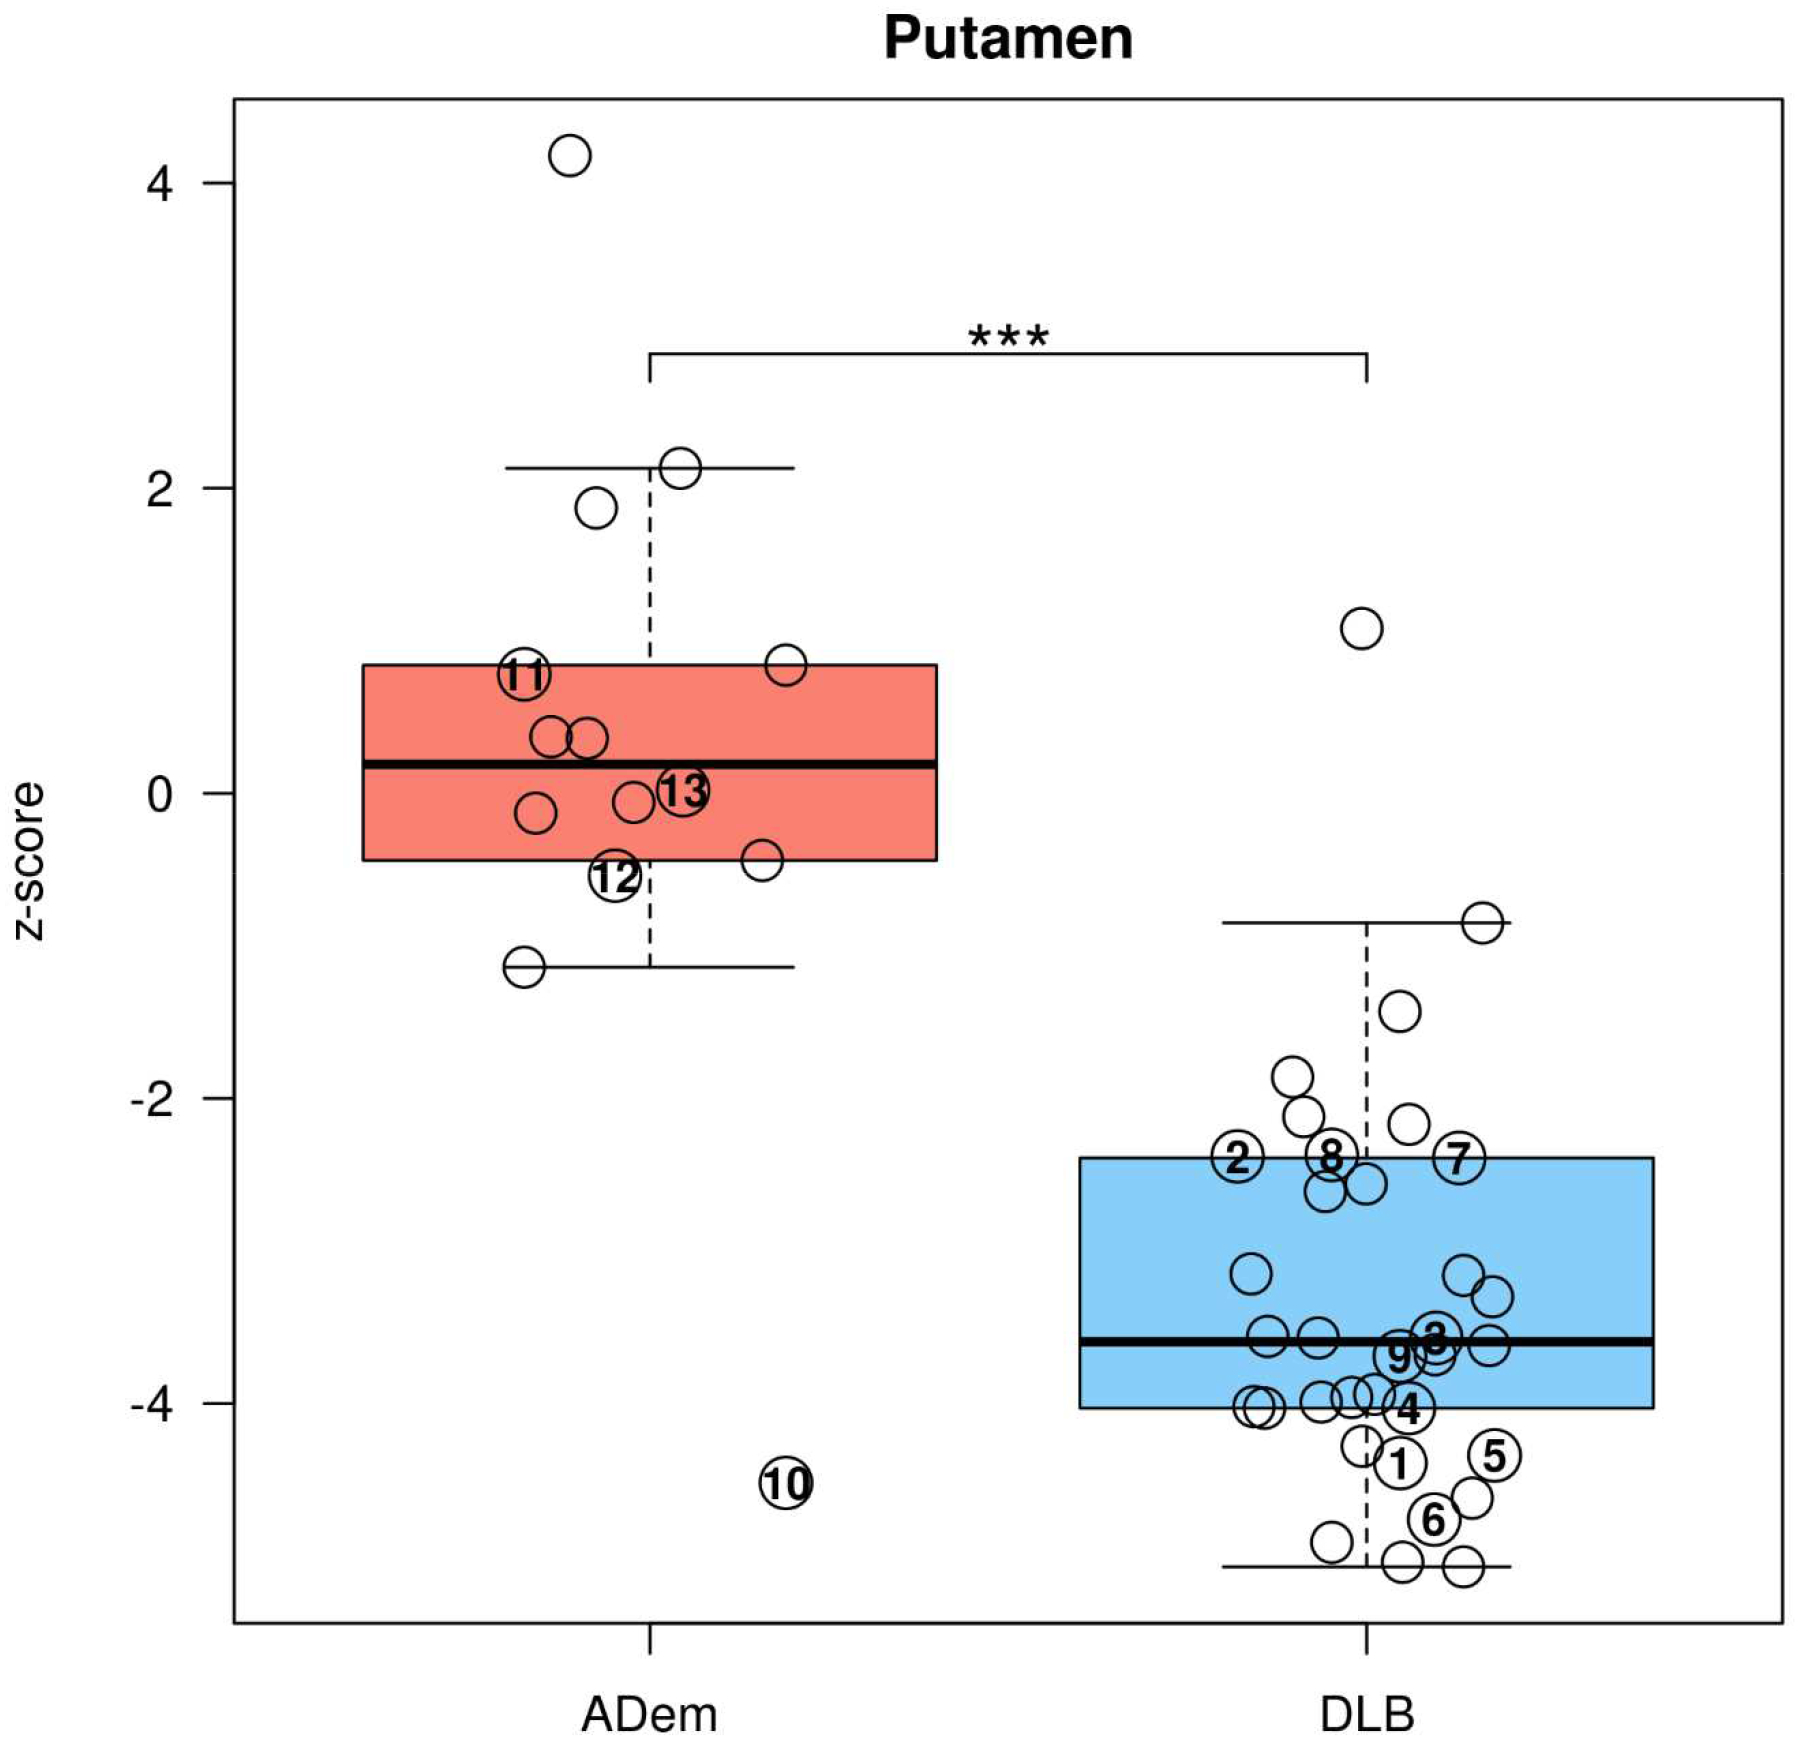
Box-and-whisker plots showing the distribution of DaTQUANT z-scores by 123I-FP-CIT SPECT for the putamen of DLB and ADem.
***p<0.001 for the difference between DLB and ADem (Student t-test).
The cases with autopsy confirmation were numbered on the plots by the same case number as Table 3. Underlying pathology for Cases 1–7 were LBD, Cases 8–11 were LBD+AD, and Cases 12–13 were AD.
