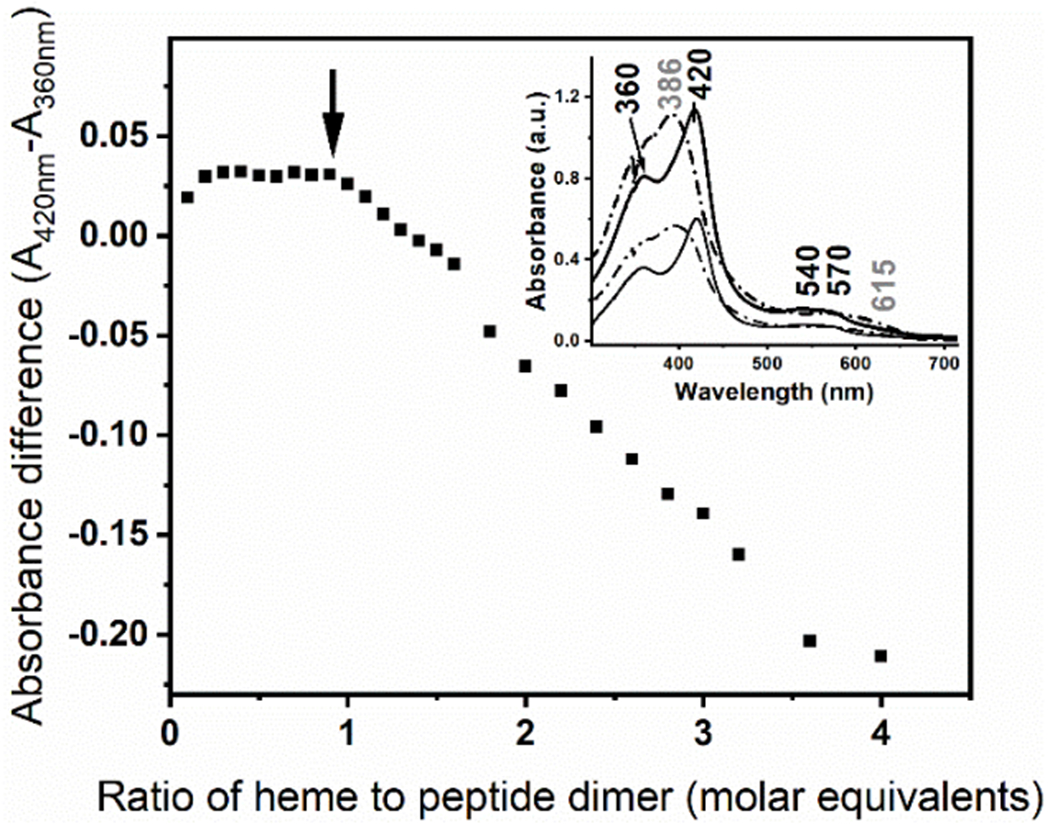
Figure 2.

Hemin titration into the GRW-L16CL30H (20 μM monomeric peptide concentration) in 250 mM TRIS-maleate buffer at pH 10.3. The difference in absorbance of the split Soret bands (360 nm and 420 nm) of the GRW-L16CL30H mini-heme protein (Inset, solid thick trace) is plotted as a function of the added hemin to peptide-dimer ratio. It clearly shows that this ratio remains constant while there is no spectral contribution of the hemin in buffer solution. Inset: The absorption spectra of the mini-heme protein obtained with 0.5 (thin solid trace) and 1 (thick solid trace) molar equivalents of heme per peptide dimer are shown. Arithmetic spectral subtractions of the “1.5 minus 1.0” (thin dashed trace) and “2.0 minus 1.0” (thick dashed trace) experimental spectra shows the expected resulting spectrum of hemin in buffer solution in both cases.
