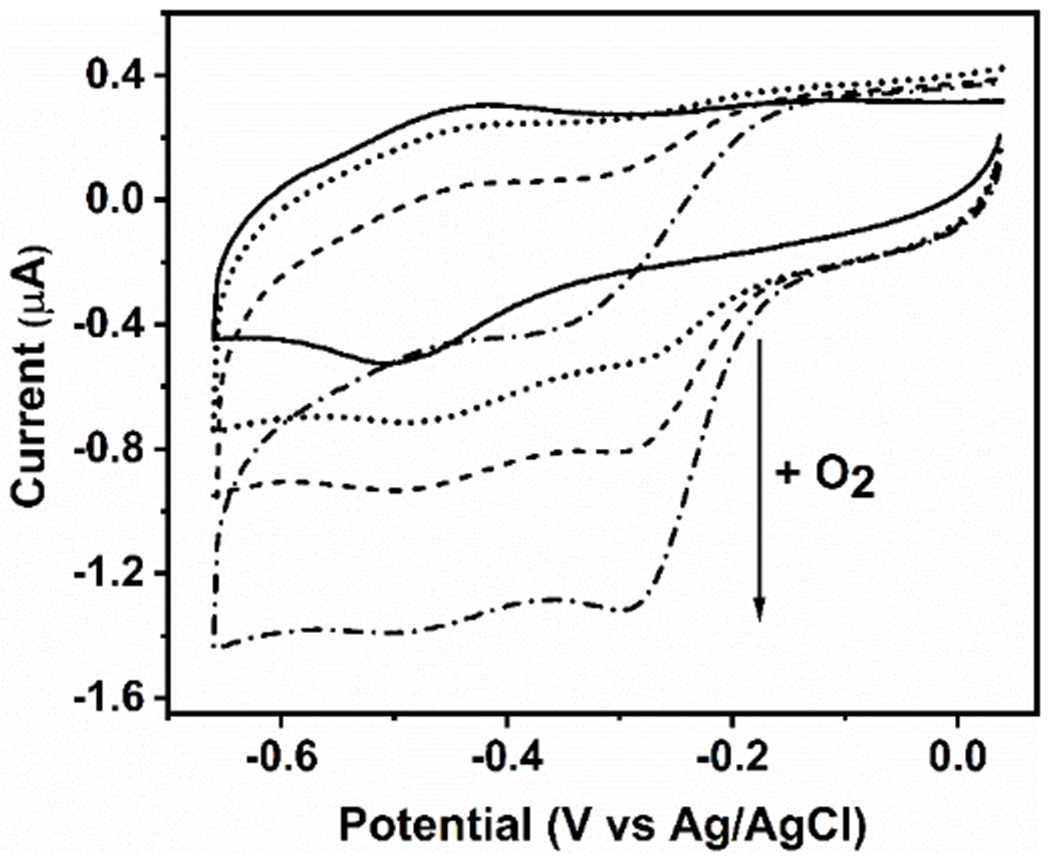
Figure 4.

Cyclic voltammograms of the GRW-L16CL30H mini-heme protein (48 μM heme and 44 μM monomeric peptide concentrations) in 250 mM TRIS-maleate buffer at pH 10.1, entrapped in a thin layer at a pyrolytic graphite electrode, 20 mV/s scan rate. In strict anaerobic conditions, the well-defined redox peaks revealed a redox potential (E1/2) at -460 mV vs Ag/AgCl for the FeIII/FeII redox couple (solid trace). In the presence of O2, the amplitude of the additional cathodic wave, with no anodic counterpart (dotted trace), was proportional to the increase in O2 concentrations (see arrow), reflecting the catalytic reduction of dioxygen by the mini-heme protein. Experimental conditions as in Fig. S8.
