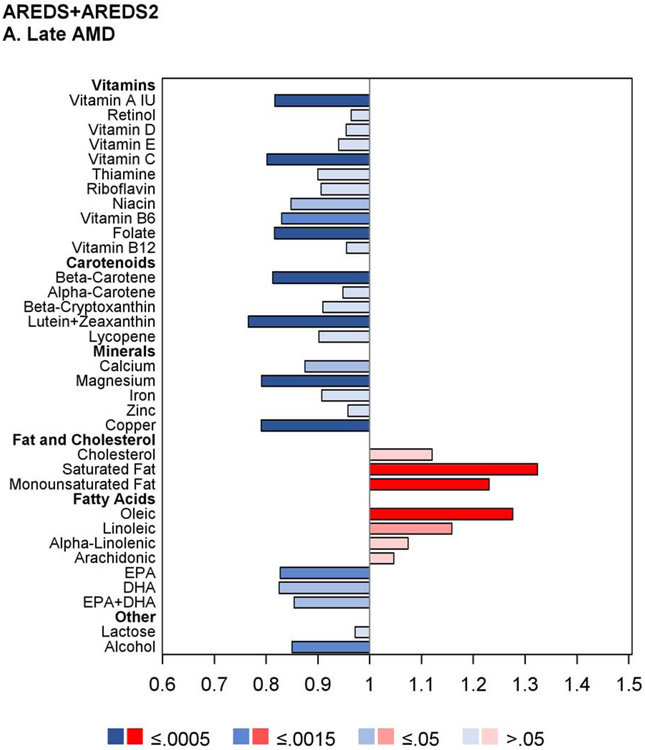
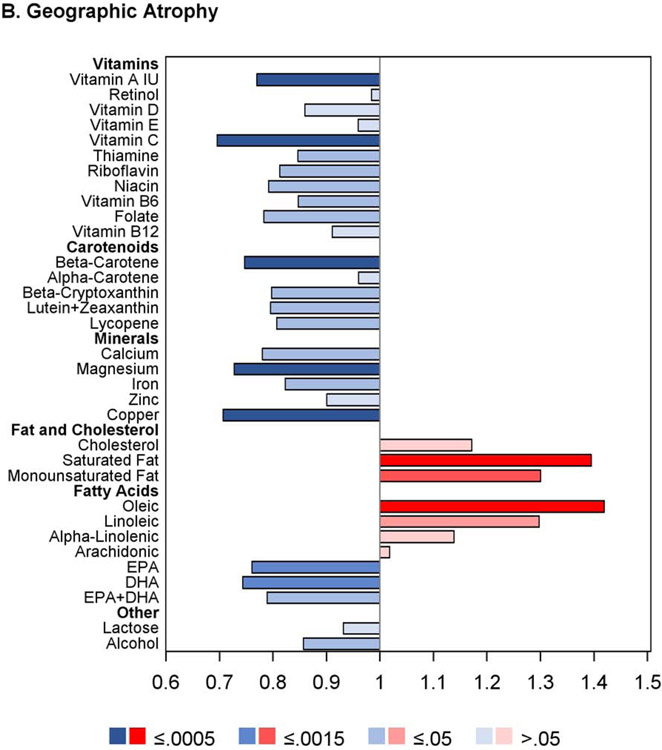
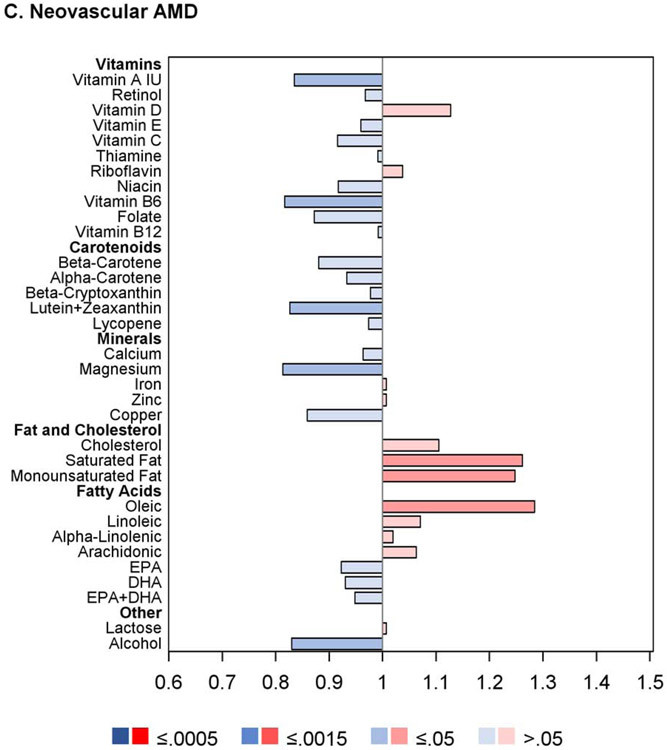
Figure 1.
Butterfly plots showing proportional hazards regression modeling of progression to late age-related macular degeneration outcomes in the combined AREDS/AREDS2 cohort. For each nutrient, the hazard ratio of dietary intake quintile 5 (with quintile 1 as reference) is shown on the x axis, with protective associations in blue and harmful associations in red; smaller P values are denoted by darker colors.


