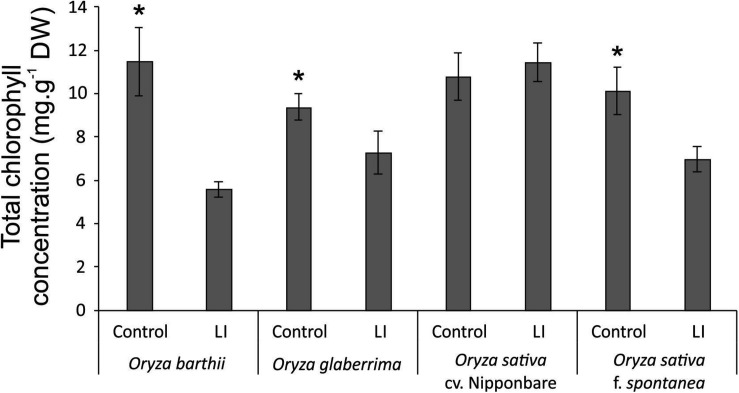
FIGURE 4.
Total chlorophyll concentration in control and late infested (LI) leaves of Oryza barthii, Oryza glaberrima, Oryza sativa cv. Nipponbare, and weedy rice (Oryza sativa f. spontanea) plants. Represented values are the averages of three samples ± SE. Mean values (from each species/cultivar: C × LI) with one asterisk are significantly different as determined by a Student’s t-test (p-value ≤ 0.05). DW, dry weight.

