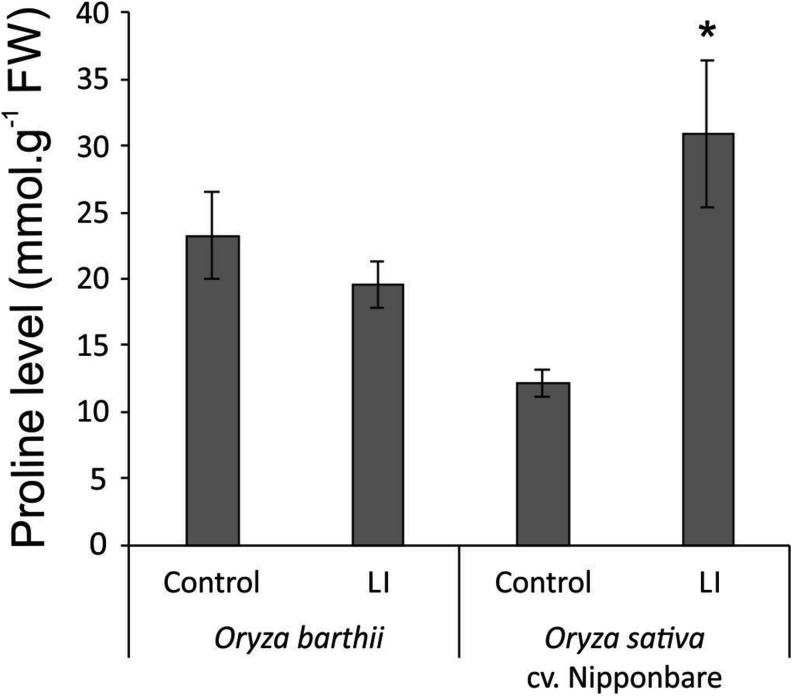
FIGURE 9.
Proline levels in control and late infested (LI) leaves of mite susceptible Oryza barthii and mite-tolerant Oryza sativa cv. Nipponbare. Represented values are the averages of three samples ± SE. Mean values with one asterisk are significantly different as determined by a Student’s t-test (P ≤ 0.05). FW, fresh weight.

