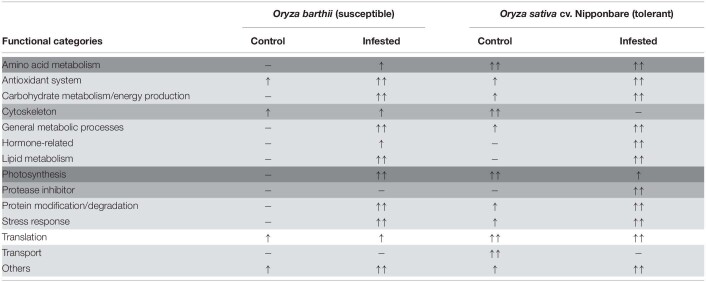
TABLE 1.
Schematic representation of the functional categories differently represented in leaves of mite susceptible Oryza barthii and mite-tolerant Oryza sativa cv. Nipponbare plants under control and infested conditions.
Different shades of gray color represent the different patterns of response. Number of arrows (one or two) relates to the representation level, which is based on the number of differentially abundant sequences. (−): functional category not detected as differentially represented.

