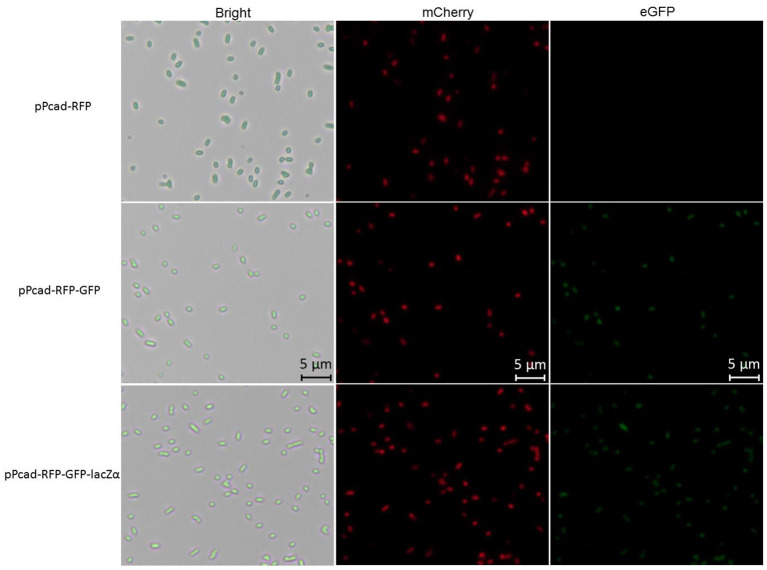
Figure 4.
Fluorescence images of TOP10/pPcad-RFP, TOP10/pPcad-RFP-GFP, and TOP10/pPcad-RFP-GFP-lacZα exposed to 5 μM Cd(II) at 30oC for 20 h. E. coli cells were visualized using a fluorescence microscope (×400 magnification). The fluorescence imaging of mCherry upon excitation at 545–565 nm and emission detection between 580 and 620 nm, and fluorescence imaging of eGFP upon excitation at 475–490 nm and emission detection between 505 and 535 nm.

