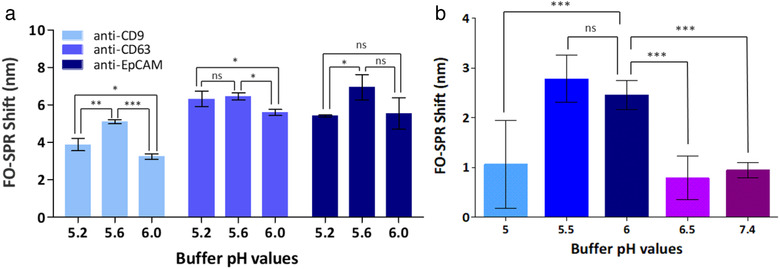
FIGURE 4.

(a) Bar graph representing the FO‐SPR shifts when immobilizing three different antibodies (anti‐CD9, anti‐CD63 and anti‐EpCAM) using three different immobilization buffers (10 mM sodium acetate buffer pH 5.2 or 5.6 and 50 mM MES buffer pH 6.0). Error bars represent the standard deviation (n = 3). (b) Bar graph representing the FO‐SPR shifts when testing rEV binding to the sensor surface, functionalized with anti‐CD9, at different pH values (ranging from 5.0 to 6.5) of 50 mM MES buffer and in PBS pH 7.4. Error bars represent the standard deviation (n = at least 2). The statistical difference between the groups was assessed by 1way ANOVA with Tukey's multiple comparison test, where *, ** and *** represents P < 0.05 and ns represents no significant difference. The statistical analysis were performed using GraphPad prism software (GraphPad Software, CA, US)
