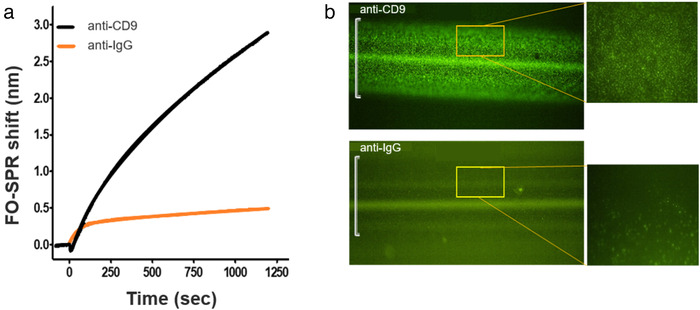
FIGURE 5.

(a) FO‐SPR sensorgram depicting the label‐free detection of rEVs (3 × 10⁹ particles/ml) using EV specific and non‐specific antibodies (i.e. anti‐CD9 and anti‐IgG, respectively). FO‐SPR shift (nm) changes were plotted as a function of time in seconds. (b) Microscopic verification of captured rEVs on the FO‐SPR sensor surface functionalized with anti‐CD9 or anti‐IgG antibodies. The images were taken using an inverted fluorescence microscope at 10x and 40x (inset) magnification. Green bright spots on the FO‐SPR surface represent the intrinsic GFP fluorescence of rEVs (ex‐488 nm/ em‐507 nm) whereas the white brackets on the microscopy images depict the width of the FO‐SPR probe core (400 μm)
