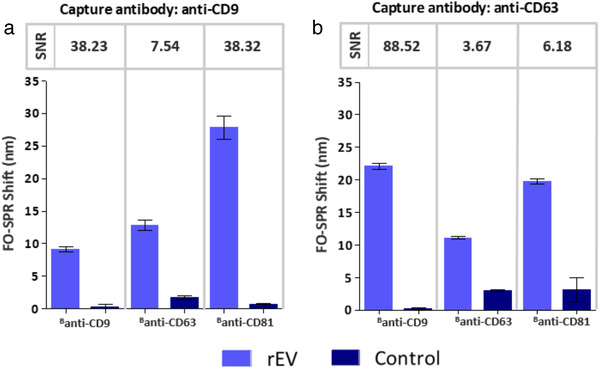
FIGURE 6.

FO‐SPR sandwich bioassay with different antibody combinations for detecting rEVs in buffer. Bar graphs represent the FO‐SPR shifts obtained by combining capture antibodies (a) anti‐CD9 and (b) anti‐CD63 with different detection antibodies (Banti‐CD9, Banti‐CD63, Banti‐CD81) for detecting rEVs at 2 × 10⁹ particles/ml concentration. Controls were performed for each antibody combination without rEVs. Respective SNR values are indicated on top of the bars. Error bars represent the standard deviation (n = 2)
