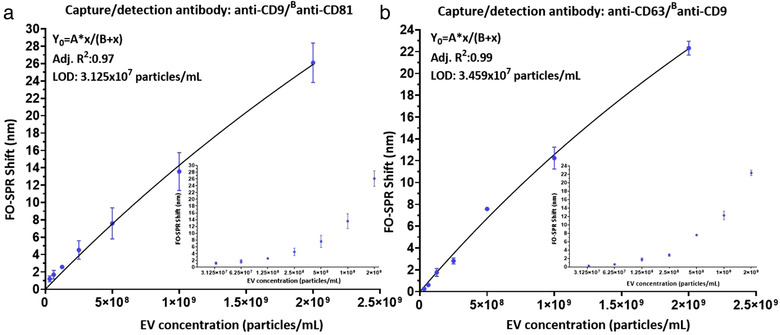
FIGURE 7.

FO‐SPR based detection of a series of rEV concentrations in the detection buffer (50 mM MES pH6, 0.01% BSA, 0.01% Tween 20) when using: (a) anti‐CD9/ Banti‐CD81 and (b) anti‐CD63/Banti‐CD9 antibody combinations. FO‐SPR shifts (nm) were plotted as a function of rEV concentrations (particles/ml). Non‐linear curve fittings were performed by prism software using specific binding equation: . Inset graphs are included to demonstrate the obtained FO‐SPR shifts in function of EV concentrations on log2 scale for better signal resolution in the lower concentration range. Error bars represent standard deviations (n = 3).
