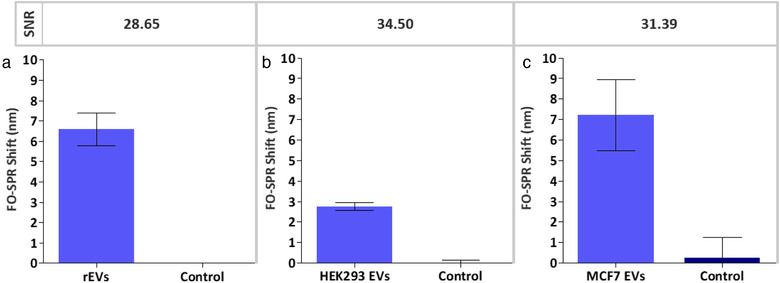
FIGURE 8.

Bar graphs representing the FO‐SPR shifts obtained when detecting (a) rEVs spiked at 2 × 10⁹ particles/ml in DMEM cell culture medium supplemented with 10% ED‐FBS and (b) endogenous HEK293 EVs (6.8 × 10⁸ particles/ml) in DMEM cell culture medium supplemented with 10% ED‐FBS, using for both conditions anti‐CD63 as capture and Banti‐CD9 as detection antibody as well as (c) MCF7 EVs spiked at 2 × 10⁹ particles/ml in 100‐fold diluted blood plasma, using anti‐EpCAM as capture and Banti‐CD63 as detection antibody. Controls represent DMEM cell culture medium supplemented with 10% ED‐FBS for A and B whereas control for C is the same blood plasma without spiked MCF7 EVs. Error bars represent standard deviations (n = 2)
