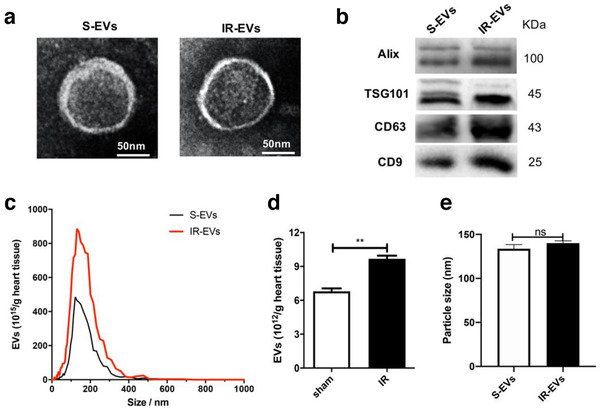
FIGURE 1.

Characterization of cardiac EVs. [(a) A representative TEM image of sham (S‐EVs) and IR‐EVs, (bar = 50 nm). (b) Protein immunoblots of EVs, including four typical exosomal markers (Alix, Tsg101, CD63 and CD9). (c) Particle size distribution of cardiac EVs was measured using nanoparticle tracking analysis (NTA). (d) Quantification of EVs isolated from sham and IR injured hearts in (c). (e) EV size detected by NTA in (c). **, P < 0.01; ns, not significant]
