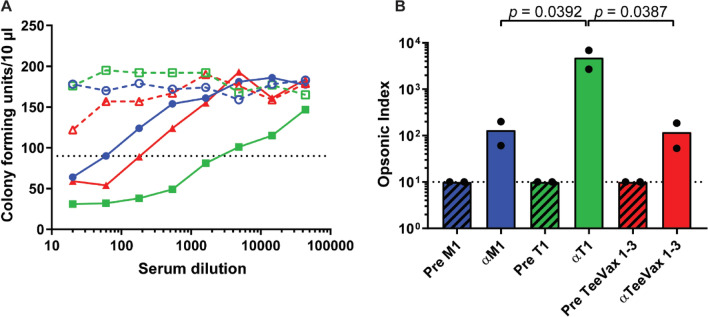
Figure 3.
OPKA of rabbit antiserum. Sera from immunised rabbits were tested in an OPKA against GAS SF370 (M1T1 strain). (A) Representative line graph showing CFU recovered after incubation with serial dilutions of M1 (blue), T1 (green), and TeeVax1 (red) antiserum. Open symbols indicate pre-immune sera, solid symbols indicate immune sera. Serum dilution resulting in 50% killing is denoted by the point at which the curve crosses the dotted line which is used to calculate the opsonic index. (B) Opsonic index (n = 2) calculated from the serum dilution resulting in 50% killing. Each biological replicate is plotted (circles), with bar representing the mean. Hashed bars indicate pre-immune serum (Pre), solid bars indicate immune serum. Dashed line denotes the limit of detection.

