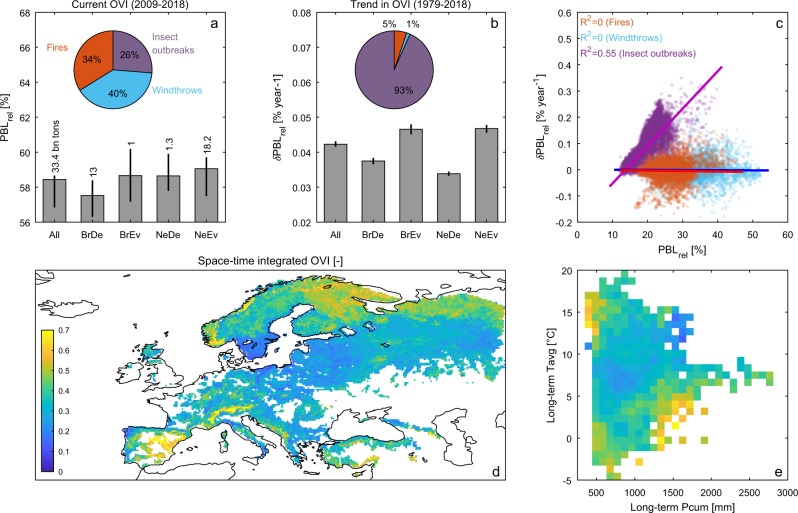
Fig. 6. Spatial and temporal patterns of the overall vulnerability of forests to multiple natural disturbances.
a Current overall vulnerability index (OVI expressed in terms of ) to multiple disturbances (averaged over the 2009–2018 period) and averaged over the whole domain (All) and separately for different plant functional types: broadleaved deciduous (BrDe), broadleaved evergreen (BrEv), needle leaf deciduous (NeDe) and needle leaf evergreen (NeEv). Bars represent the average value of the 15,797 0.25° grid cells weighted by their forest area extent; whiskers reflect the corresponding 95% confidence intervals while vertical labels report the total vulnerable biomass. The inset chart shows the marginal contribution of each natural disturbance to the OVI computed over the entire domain. b as a but for the trends in OVI computed for the 1979–2018 period (expressed in terms of ). c Current grid-cell vulnerability and their trend for each disturbance type. Labels report the coefficient of determination of the linear regression shown as coloured lines. d Spatial map of the space-time integrated OVI. Forests with cover fraction lower than 0.1 are masked in white. e Space-time integrated OVI binned as a function of the long-term cumulated precipitation (on the x-axis) and average temperature (on the y-axis).

