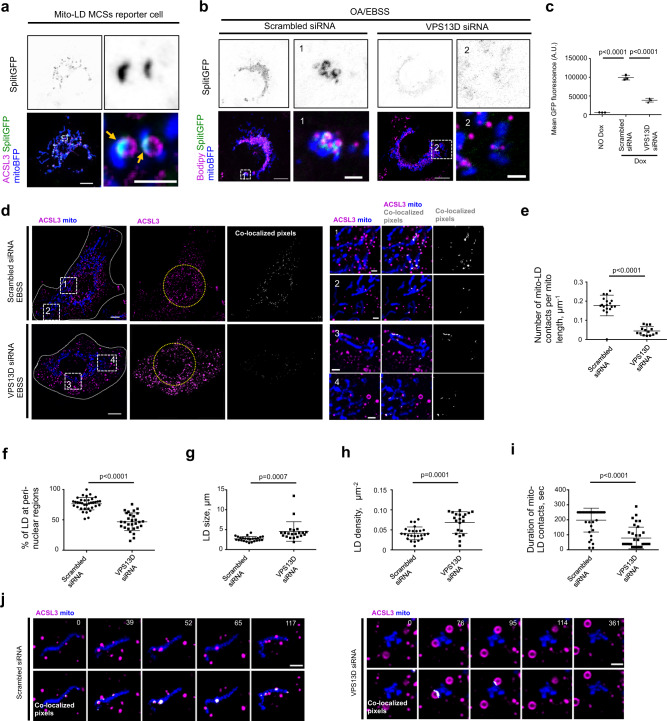
Fig. 5. VPS13D was required for maintenance of mitochondria-LDs interactions.
a Confocal image of a Dox-inducible mitochondria-LDs MCSs reporter cell expressing mitoBFP (blue) and ACSL3-Halo (magenta). Yellow arrows denoted the reconstituted GFP (green) at MCSs. SplitGFP representing the reconstituted GFP fluorescence at mitochondria-LD junctions. b Cells as in a were treated with either scrambled or VPS13D siRNAs under OA/EBSS. Left: whole cell image; Right: one inset from a boxed region in whole cell image. c Quantification of mean GFP fluorescence intensity of mitochondria-LDs MCSs reporter cells upon treatment with either scrambled or VPS13D siRNAs by flow cytometry. A.U., arbitrary unit. d Confocal image of HEK293 cells expressing ACSL3-Halo (magenta) and mitoBFP (blue) upon treatments with scrambled (top panel) or VPS13D siRNAs (bottom panel). Left: whole cell image; Right: two insets from boxed regions in whole cell image with co-localized pixels in white representing MCSs. e Quantification of number of mitochondria-LDs MCSs per mitochondrial length; 18 scrambled siRNA treated cells and 14 VPS13D siRNA treated cells were calculated. f Percentage of LDs at peri-nuclear region; 36 scrambled siRNA treated cells and 29 VPS13D siRNA treated cells were calculated. The peri-nuclear region was defined as 10 μm distal to rims of nucleus. g, h Quantification of LDs size (g) and density (h); 25 scrambled siRNA treated cells and 21 VPS13D siRNA treated cells were calculated. i Duration of mitochondria-LDs interactions. 35 ROIs with well-resolved mitochondria and LDs from scrambled siRNA treated cells and 35 ROIs from VPS13D siRNA treated cells were calculated. j Representative time-lapse images of cells as in d with white pixels representing possible mitochondria-LDs junctions. At least three independent imaging sessions were performed with similar results in c, e–i. The statistic analysis was performed with two-tailed unpaired student’s t-test, and data are means ± SD in c, e–i. Time in sec. Scale bar, 10 μm in whole cell image and 2 μm in insets in a, b, d and 2 μm in j.

