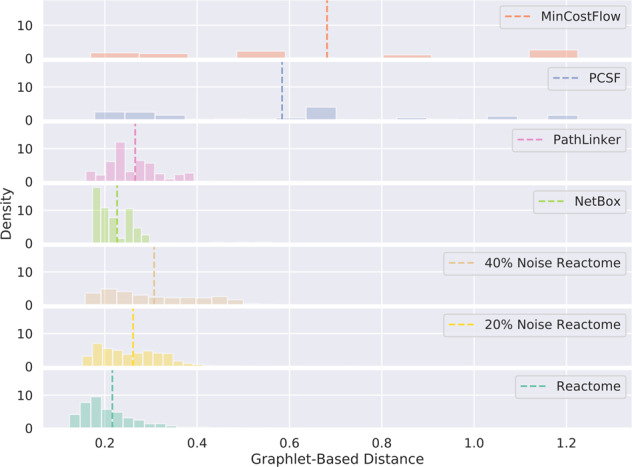
Fig. 9. Distribution of aggregated graphlet-based distances (E(G)) for reconstructed pathways, Reactome pathways, and Reactome pathways with added noise.

These aggregate distances were the metric used by pathway parameter advising to rank pathways, with lower distances being ranked higher. They were calculated by comparing the candidate pathway (reconstructed pathway, Reactome pathway, or noisy Reactome pathway) with all of the reference Reactome pathways. Distributions for pathway reconstruction methods are made up of all reconstructions performed across all parameter settings tested on the 15 NetPath pathways. However, Reactome pathways were excluded from their own distance calculation. Vertical dashed lines show the mean graphlet distance.
